How to Rock Your Lead Scoring System Using These 3 Best Practices
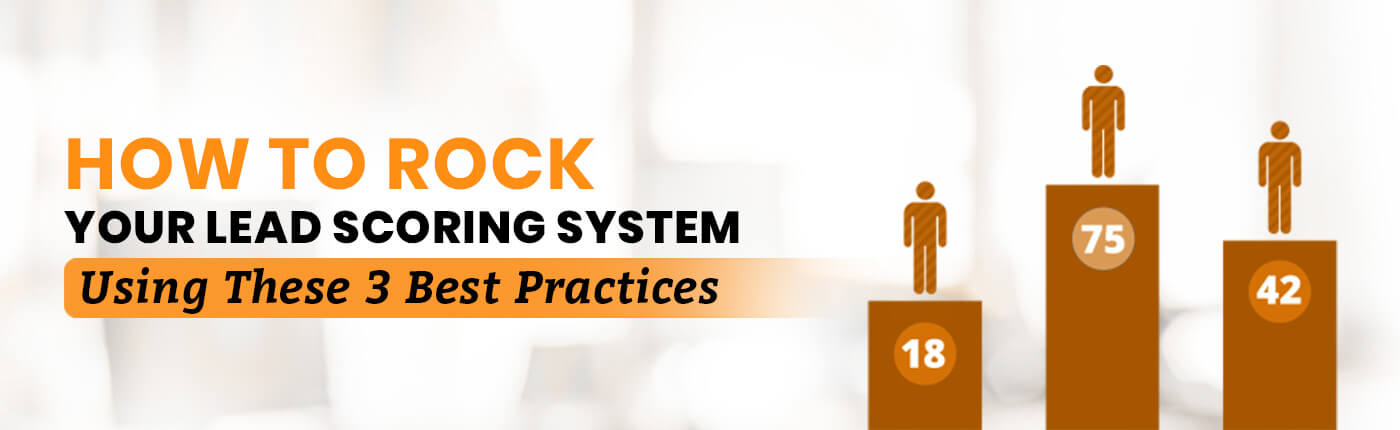
WARNING: LEAD SCORING SYSTEM CAN MAKE OR BREAK SALES TARGET IN A GIVEN MONTH. We all (already!) know that consumers cannot be sales ready at all times. But still, Unqualified leads are the biggest waste of time for sales. So ironic! What is the result? You’re disappointed and stressed. Your sales team don’t meet their targets, so no bonus for them. *discouraged* Your revenue decreases. There is a simple fix for this STRESSFUL situation. A lead scoring mechanism. Here are the 3 best practices to create a lead scoring system. Must Read: How the lead generation in USA market differ from the rest of the world 1. Involve sales and marketing team  Let’s be logical. You may know your buyers but Your sales and marketing team interact with them daily! So they are the best people to help you determine criteria for setting up a lead scoring system. This criterion can be implicit or explicit based on your buyer persona. While explicit information deals with budget, authority, need, timeline etc (basically the BANT); implicit information deals with actions: page views, downloads, providing contact information etc. Take out your marker, whiteboard and begin asking: What does the ideal lead look like? Why do some leads end up being disqualified? Which content pieces or how many of these pieces have successful leads consumed? Which referral source has the highest close rate? etc Once you have all the relevant information, put them in order of importance and give it a numerical value. For example, factors relating to need and budget are critical (meaning, more points!) while watching a seminar or downloading an ebook can be an influencing factor (meaning, lesser points) So, You have the basic mechanism ready now!  Must Read: Sales success secrets: The critical role of lead generation and appointment setting 2. Negative scoring We all hated negative marking in exams (at least I did)! But, do you remember how it increased your accuracy? While we all love to score positive actions, negativeswill increase your accuracy while qualifying leads (Sales qualified or Marketing qualified). This is Mr. Batman. Due to FBI in action, he is jobless. He visited your website (especially the careers page) and given you implicit signals (multiple page views, downloads etc). You keep adding points for his activities. Now, he hasn’t paid you a visit for long. Don’t you want to track all of that? Deduct points for visiting only career page or not visiting for long? Obviously, you do! If you don’t, you will end up inflating scores. Mr. Batman is just a job seeker after all. While it may seem obvious, NOT a lot of businesses follow it. So, why not have that in place from the beginning? Don’t let your sales team get frustrated with catch-up game. Implement a lead scoring system instead. Must Read: 10 Lead Generation Best Practices and Examples 3. Threshold   You can’t keep scoring your leads to the maximum. You gotta have a threshold! So if you can score up to 100, keep the threshold at 80. I know it is common sense. But, 46% of B2B marketers have NOT set up a lead scoring threshold that will automatically alert or route leads to sales. (Spear Marketing) Reminds me of this guy – Once your lead reaches the threshold, it should be automatically assigned to your sales team. You can do this with a marketing automation tool. Alternatively, a lead management software can help you auto score or re-score your leads. Voila! It not only makes it easy for the team, it minimizes the guesswork. Who wouldn’t like that? If you have already implemented a lead scoring system, do comment below and share your experience with us.

Key Difference Between Appointment Setting and Telemarketing

Sales and outbound outreach sit at the center of how most B2B businesses grow. That is also why the roles of telemarketing and appointment setting often get grouped together. Both involve prospect conversations, outbound communication, and business development, so on the surface, the difference can seem small. But the intent behind them is very different. Telemarketing is generally built to create reach and open conversations at scale. Appointment setting is designed to create qualified meetings that have a stronger chance of moving into the pipeline. According to pricing benchmarks referenced by SalesAR, the average cost per qualified appointment has increased significantly year over year, making outreach efficiency and qualification quality more important than ever. As sales cycles become more competitive and buying journeys become more layered, understanding the difference between appointment setting and telemarketing becomes important for choosing the right outbound approach at the right stage of growth. What Is Telemarketing? The telemarketing meaning has evolved over time, but the core principle remains the same. Telemarketing is a broad outbound communication approach focused on reaching a large number of contacts through phone-based outreach. The objective was visibility, awareness, lead generation, survey collection, promotions, or initial buyer engagement. Success often depended on the volume of outreach rather than the depth of qualification. In many organizations, telemarketing teams operate through structured scripts, predefined workflows, and high daily call targets. The process is designed for consistency and repeatability. For certain industries, markets, and campaign goals, mass outreach still serves a purpose. Companies launching into new regions, validating market demand, promoting time-sensitive offers, or collecting basic lead data may benefit from telemarketing campaigns. Many B2B organizations expect telemarketing efforts to produce highly qualified meetings with decision-makers who are already aligned on pain points, budget realities, and buying intent. That is rarely how broad outbound systems work. Telemarketing creates surface-level engagement efficiently. It opens doors, generates initial responses, and increases top-of-funnel activity. But activity and momentum are not the same thing. This is why telemarketing vs appointment-setting conversations often become less about outreach mechanics and more about sales maturity. What Is Appointment Setting? Appointment setting is a targeted outbound process built to secure qualified sales meetings with prospects that closely match an ideal customer profile. It is centered around identifying the right accounts, understanding business context, and creating conversations worth continuing. This difference changes how the entire process operates. An appointment setter or SDR outreach team typically spends significant time researching accounts before outreach even begins. They look at industry fit, company size, decision-maker roles, operational triggers, technology stack, expansion signals, or hiring patterns. Instead of following a generalized script, conversations are adapted to the prospect’s environment, priorities, and likely business pressures. The objective is not simply to generate interest. It is to determine whether a meaningful sales conversation should happen at all. That is why appointment setting often sits much closer to revenue strategy than traditional outbound activity. The strongest appointment setting programs are optimized for sales continuity. Appointment Setting vs Telemarketing The easiest way to understand appointment setting vs telemarketing is to look beyond channels and focus on intent. Area Telemarketing Appointment Setting Primary Objective Broad outreach and awareness Qualified meetings for sales pipeline Targeting Approach Larger contact databases ICP targeting and account selection Qualification Depth Basic qualification Multi-layer account qualification Outreach Style Script-driven Personalized and research-led Performance Focus Call volume and contact rates Meetings booked and pipeline movement Buyer Engagement Early-stage interaction Sales-ready conversation building Conversion Quality Higher variability Higher intent alignment Team Structure Call-center oriented SDR and sales development focused It’s important to learn about this difference, as it helps organizations to plan better and have expectations that make sense. When to Use Telemarketing vs Appointment Setting The decision between telemarketing vs appointment setting should come from business objectives. Companies often default toward whichever model appears more scalable or more affordable in the short term. But outbound effectiveness depends less on activity volume and more on alignment with the buying environment. Telemarketing tends to work best when the objective is reach. This includes scenarios like: These situations benefit from speed and coverage. Appointment setting becomes more valuable when the sales process requires deeper context, stakeholder engagement, and stronger qualification. This typically applies to: The distinction becomes even more important in industries where buying decisions involve operational risk. When buyers are evaluating vendors tied to revenue, infrastructure, compliance, or transformation goals, generic outreach rarely creates meaningful traction. Decision-makers respond differently when the outreach reflects familiarity with their business environment. This is why mature B2B sales strategy increasingly prioritizes quality of engagement over raw activity metrics. Targeting & Qualification Differences Targeting and qualification work very differently in appointment setting vs telemarketing because the purpose behind both approaches is not the same. As the goals change, the targeting methods, outreach style, and qualification process naturally change with them. Traditional telemarketing systems are usually built around scale efficiency. Lists are often broader, qualification criteria are lighter, and outreach is designed to maximize contact rates across larger databases. This approach can generate significant activity quickly, especially in markets where reach matters more than precision. The tradeoff here is relevance. Broader outreach naturally creates lower alignment between messaging and buyer context. As campaigns scale, personalization often becomes difficult to maintain consistently. Appointment setting operates differently because the filtering process starts before outreach begins. Instead of asking, “How many contacts can we reach?” the process asks, “Which accounts are most likely to convert into meaningful opportunities?”. This matters because account qualification is no longer just a sales exercise. In modern B2B outreach, qualification shapes efficiency across the entire revenue system. Strong qualification creates cleaner sales handoffs, better discovery conversations, and higher downstream conversion stability. Conversion Rates & ROI Comparison The conversation around conversion rates often becomes misleading because many organizations measure outbound success too early in the funnel. Telemarketing campaigns may generate high contact activity, larger response pools, or increased engagement volume. On reporting dashboards, this can initially look productive. But pipeline value is rarely determined at

Sales Pipeline Coverage Ratio: What It Is & How to Calculate It

Many sales teams enter the final weeks of a quarter believing the pipeline is strong. The CRM shows a lot of open opportunities, forecasts appear confident, and activity levels across the team remain high. Yet when the quarter closes, the numbers fall short. More often, the pipeline simply never contained enough qualified opportunity value to support the revenue target. This is where pipeline coverage becomes important. According to HubSpot, organizations that maintain consistent pipeline coverage are far more likely to achieve predictable revenue outcomes. The metric reveals whether the pipeline can realistically support the quota before the revenue gap appears. Something closely tied to how effectively your B2B lead generation strategy is driving qualified opportunities. Understanding the sales pipeline coverage ratio allows leaders to identify risk early and correct it before it reaches the forecast. What Is Sales Pipeline Coverage Ratio? The sales pipeline coverage ratio measures how much pipeline value exists compared to the revenue target a sales team needs to close. In simple terms, it answers one question. Do you have enough opportunities in the pipeline to realistically hit your revenue goal? Sales leaders often assume pipeline volume automatically translates into revenue. The coverage ratio corrects that assumption by introducing probability into the conversation. A pipeline may look large on the surface but still be insufficient once win rates, deal timelines, and qualification quality are considered. This is why the metric has become a core sales pipeline metrics benchmark used by revenue leaders to assess pipeline health and forecasting confidence. Instead of asking whether pipeline exists, the ratio asks whether enough pipeline exists. Pipeline Coverage Ratio Formula The pipeline coverage ratio formula is straightforward. Pipeline Coverage Ratio = Total Pipeline Value / Revenue Target To illustrate how to calculate pipeline coverage ratio, imagine a team carrying $3 million in open opportunities while their quarterly quota is $1 million. The calculation becomes: 3,000,000 / 1,000,000 = 3 The team therefore has a pipeline coverage ratio example of 3x. This means the pipeline currently contains three times the value required to reach the revenue target. At first glance, this may appear sufficient. However the ratio alone does not determine whether the pipeline is healthy. The interpretation depends on win rates, sales cycle length, deal size variability, and segmentation across the business. Pipeline coverage is therefore less about a static number and more about understanding the conditions behind it, including how effectively your content syndication strategy contributes to pipeline volume and quality. What Is an Ideal Pipeline Coverage Ratio? The commonly referenced benchmark for pipeline coverage ratio is 3x to 5x. In practice, this means the total value of open opportunities should be roughly three to five times larger than the quota the team needs to close. The assumption behind the rule is simple. If a team closes roughly one out of three deals, a 3x to 5x pipeline should theoretically produce enough wins to reach the target. According to HubSpot, the companies that consistently have high coverage ratios typically achieve forecast rates above 90%. But the ideal pipeline coverage ratio rarely remains identical across companies. Different industries, deal sizes, and buying processes create different coverage requirements. Organizations with high close rates might operate comfortably with lower coverage. Teams selling complex enterprise solutions often require higher coverage because fewer deals close and timelines are longer. The ratio should therefore be treated as a directional signal rather than a rigid rule. When used properly, it becomes an early indicator of future revenue pressure. How Win Rate Impacts Coverage Needs Coverage ratios become more precise when win probability enters the equation. The relationship can be expressed with a simple calculation. Required Coverage = 1 / Win Rate This is where win rate impact becomes visible. If a sales team closes 25 percent of their opportunities, the required coverage becomes: 1 / 0.25 = 4 In this scenario the organization needs a 4x pipeline to confidently reach its target. If the close rate improves to 33 percent, the required coverage drops closer to 3x. Understanding this relationship transforms pipeline management and aligns closely with improving lead qualification and scoring processes to increase win rates. Instead of chasing arbitrary pipeline volume, leaders can align coverage expectations with actual conversion performance. The result is a more realistic foundation for revenue forecasting. Pipeline Coverage & Sales Cycle Length Enterprise deals often move through multiple stakeholders, budget approvals, and evaluation phases. These steps extend deal timelines and reduce the number of opportunities that close within a quarter. As cycle length increases, organizations typically require greater pipeline coverage ratio to protect their forecast. Short cycle environments such as transactional software or SMB products operate differently. Deals progress faster, and new opportunities can enter the pipeline quickly, allowing coverage ratios to remain lower without introducing the same level of risk. Segment-Based Pipeline Coverage Pipeline requirements also shift across segments of the business. Enterprise accounts typically involve higher ACV, longer buying committees, and more complex decision processes. These dynamics create slower conversion patterns and higher variability in outcomes, which is why many organizations rely on B2B content syndication services to generate high-intent enterprise leads. SMB segments operate with smaller deal sizes but faster movement through the funnel. This difference makes revenue segmentation an important lens for analyzing coverage. A company selling across enterprise, mid-market, and SMB should avoid applying a single coverage expectation across all segments. Each segment produces different pipeline behavior and therefore requires its own interpretation of the pipeline coverage ratio. Rep-Level vs Company-Level Pipeline Coverage Pipeline metrics become more meaningful when examined at multiple levels of the organization. At the rep level, the goal is to understand whether an individual salesperson has enough pipeline to realistically reach their quota. Rep-Level Coverage Formula: Rep Pipeline Coverage = Individual Rep Pipeline Value / Individual Rep Quota For example, if a salesperson carries $900,000 in qualified opportunities and their quarterly quota is $300,000, the calculation becomes: 900,000 / 300,000 = 3 This rep therefore has 3x coverage against their quota.

B2B Marketing Trends & Predictions for 2026

Most B2B marketing teams aren’t struggling because they lack tools, talent, or effort. They’re struggling because everything they do costs more attention than buyers are willing to give. Budgets are tighter. Buying groups are larger. AI-generated answers shape perception before a sales conversation even exists. And trust, once assumed, now must be earned repeatedly. The result is quite frustrating: campaigns launch, content ships, dashboards fill up, yet impact feels harder to prove. According to Gartner, 75% buyers now complete most early-stage evaluation without vendor interaction, leaving marketing accountable for influence it can’t easily track. This is the pressure defining B2B marketing trends in 2026. The 2026 Trend Snapshot (Read This First) This snapshot captures the directional shifts shaping how marketing is planned, executed, and evaluated. It reflects how buyer behavior, trust dynamics, and operational expectations evolve together. Together, these eight shifts explain why familiar B2B playbooks feel less effective—and where execution must change to stay credible in 2026. What changed What to do KPI Trend AI becomes infrastructure What changed AI stops being a productivity add-on and becomes the operating layer behind research, execution, and optimization. What to do Standardize inputs (ICP, messaging, offers) before automating outputs. KPI Execution velocity (cycle time, handoffs, revisions) Trend Search becomes an answer economy What changed Buyers increasingly trust AI-generated answers, not search results. Visibility depends on being cited, not clicked. What to do Design content to be referenced: direct answers, clear structure, verifiable logic, restrained claims. KPI Citation-driven demand (brand/direct lift, mentions) Trend Trust becomes measurable What changed Skepticism rises, verification becomes standard, and credibility directly affects pipeline movement. What to do Lead with proof (validation assets, fit boundaries, consistent narratives across teams). KPI Stage conversion (SQL→Opp, Opp→Won) Trend Experiences return with accountability What changed Events and webinars matter again, but only when tied to revenue influence, not attendance. What to do Design experiences for reuse + follow-up plays from day one (content, enablement, ABM). KPI Influenced pipeline (event→meeting rate, opp assist) Trend People outperform brands in distribution What changed Employees and founders drive reach and trust more effectively than polished brand channels. What to do Enable voices with shared narratives + guardrails (no scripts, no forced posting). KPI High-intent engagement (DMs, saves, referrals) Trend Transparency becomes a growth lever What changed Clear disclosure around AI use and claims reduces risk and increases buyer confidence. What to do Define acceptable AI use cases + review steps + disclosure standards where outcomes are affected. KPI Trust friction (security blocks, claim pushback) Trend Demand creation replaces lead capture What changed Long-term belief building outperforms short-term form fills as buying cycles lengthen. What to do Build always-on content + distribution and measure influence on pipeline, not just leads. KPI Branded/direct growth + content depth before sales Trend ABM becomes operational, not aspirational What changed Account-based marketing works when tiered, governed, and aligned to buying group reality. What to do Tier accounts (1:1 / 1:few / 1:many), review quarterly, align ownership and plays. KPI Account→meeting rate (coverage, intent lift, win rate) Trend 1: AI Agents Go Mainstream (But Humans Still Drive Strategy) AI agents are no longer experimental add-ons. In 2026, they operate as a persistent workflow layer across marketing operations. Research, planning, execution, personalization, reporting, and optimization increasingly happen inside connected AI-driven systems rather than isolated tools. This matters because marketing complexity has outpaced human coordination. Campaigns fail less often due to bad ideas and more often due to fragmentation. Inputs live in different places. Decisions are delayed. Feedback arrives too late to matter. AI agents change this by reducing coordination costs. They synthesize market research continuously instead of periodically. They update ICP assumptions based on live signals. They adapt messaging variations without manual intervention. They flag performance issues while there is still time to respond. The impact on teams is structural: However, AI does not solve strategic ambiguity. It exposes it. Teams with unclear positioning, weak differentiation, or misaligned goals experience faster failure, not better results. AI amplifies intent. It does not create it. Managing this trend requires discipline: AI in B2B marketing becomes a force multiplier only when thinking is already aligned. Trend 2: AI Search Becomes the New Gatekeeper Search is no longer a destination. It is an intermediary. By 2026, AI-generated overviews, summaries, and direct answers increasingly determine what buyers see, trust, and remember. Traditional rankings still matter, but they no longer control first impressions. Around 79% of global B2B buyers say AI search has changed how they conduct research. This fundamentally changes content economics. Visibility now depends less on keyword coverage and more on citation-worthiness. AI systems compress information. They reward clarity, originality, and specificity while filtering out repetition. For marketing teams, the impact is immediate: This is where AI search and visibility intersect with brand trust. Content that influences AI answers tends to share common traits: original framing, clear structure, restrained claims, and verifiable logic. The goal shifts from “ranking a page” to “shaping the answer buyers internalize.” Managing this trend requires a re-framing of content strategy: AI answers in search reward those who reduce cognitive load, not those who add to it. Trend 3: Trust Will Decide Who Wins Pipeline Trust becomes the quiet differentiator in 2026. As automation increases across marketing and sales, buyer skepticism rises in parallel. Forrester predicts 75% of B2B companies will increase budgets for influencer relations, as trust is the defining competitive variable across B2B marketing, sales, and product organizations. This does not mean buyers distrust vendors by default. It means they verify before they engage. The impact of this on pipeline is significant as: Trust moves from branding into execution detail. Pricing logic. Use-case clarity. Fit boundaries. Transparency about trade-offs. These elements increasingly influence buying groups who are trying to reduce internal risk. Managing trust requires restraint: B2B trust is built by removing doubt, not adding confidence. Trend 4: Experience Marketing Comes Back (With a Revenue Lens) Experience marketing has returned in 2026. Hybrid events, webinars, and curated experiences regain relevance as

How to Qualify an MQL: A Practical Guide for B2B Marketing Teams

Most B2B marketers already know the uncomfortable truth about MQLs. Lead volume is rarely the issue. Campaigns perform, dashboards look healthy, and forms continue to fill. Yet when those MQLs reach sales, the response is often muted. Follow-ups are delayed. Rejection rates rise. Pipeline contribution falls short of expectations. This disconnect is not new. It has simply become more visible as buying behavior has changed. MQL qualification was designed for a time when buyers raised their hands earlier, research happened on vendor websites, and individual actions clearly signaled intent. That world no longer exists. Today’s buyers move quietly, research independently, and involve multiple stakeholders long before speaking to sales. Qualifying MQLs effectively now requires rethinking what “qualified” really means and aligning it with how buyers actually behave. Why MQL Qualification Feels Broken for Many B2B Teams For most marketing teams, MQL qualification still follows a familiar pattern. A lead meets basic firmographic criteria and engages with content. Points are added. A threshold is crossed. The lead is passed to sales. On paper, the logic still makes sense. In practice, it often fails. Hubspot reports that nearly 70% of B2B marketers say lead quality is their biggest challenge, even as lead generation performance improves. This suggests that the problem is not attracting interest, but interpreting it correctly. (Source: Hubspot State of Marketing Report) Buyers now consume content anonymously across dozens of channels. A single download may reflect casual research rather than buying intent. Multiple stakeholders may be involved, each engaging separately. When MQL qualification treats these fragmented signals as readiness, sales teams inherit the risk. What Most Marketers Already Get Right About MQLs Despite these challenges, many assumptions behind MQLs are still correct. Not every lead should be sent to sales. Some level of qualification is essential to protect sales time and focus effort. Engagement still matters. Account fit still matters. The goal has always been to identify leads more likely to convert. Where things break down is not strategy, but execution. HubSpot research shows that only 27% of marketing-generated leads are considered sales-ready once reviewed by sales teams. The gap is rarely caused by lack of effort. It is caused by qualification criteria that no longer reflect buying readiness. Source: HubSpot, State of Marketing Report To move forward, MQL qualification needs to evolve without abandoning its original purpose. How to Qualify MQLs Around Buying Readiness At its core, MQL qualification should answer one question: Is this lead likely to engage in a meaningful sales conversation now or in the near future? That question is more nuanced than it appears. A modern MQL definition balances three signals that marketers already recognize, but often evaluate separately. When these signals converge, confidence in qualification increases. When they do not, passing the lead to sales prematurely creates friction. This shift reframes MQLs from activity milestones to indicators of buying readiness. The Signals That Indicate a High-Quality MQL Account Fit Sets the Ceiling for Value Most marketing teams agree that fit matters. Where qualification often falls short is prioritization. An engaged lead from a low-fit account still represents limited revenue potential. Meanwhile, moderate engagement from a high-fit account may be far more meaningful when viewed in context. Strong MQL qualification treats account fit as a gate, not a score multiplier. Leads outside the Ideal Customer Profile are nurtured rather than escalated. Engagement Patterns Matter More Than Individual Actions Engagement is not binary. A single interaction rarely tells the full story. Repeated visits, cross-channel engagement, and movement toward product-focused content signal a different level of interest than one-off downloads. These patterns often reflect internal discussion rather than individual curiosity. Qualification improves when engagement is evaluated as a journey rather than a point event. Intent Signals Fill the Visibility Gap Much of today’s buyer research happens outside vendor websites. Third-party intent data reveals what topics accounts are researching across publisher networks, review platforms, and comparison sites. When this external research aligns with internal engagement, buying readiness becomes clearer. Gartner found that B2B organizations using intent data to support lead qualification reduce wasted sales outreach by over 25%, largely by engaging fewer leads at the right time. Source: Gartner, Intent Data for B2B Marketing (Source: Gartner, Intent Data for B2B Marketing) How to Build an MQL Qualification Framework Sales Will Trust Effective MQL qualification cannot be owned by marketing alone. High-performing teams co-create qualification frameworks that consider fit, engagement depth, intent strength, role relevance, and timing. This shared structure ensures that MQLs reflect sales reality rather than marketing activity. Timing plays a critical role. Not every qualified lead is ready for immediate outreach. Some belong in accelerated nurture paths, while others warrant prompt sales engagement. When sales understands why a lead is qualified and marketing understands why leads are rejected, alignment improves naturally. Advanced Ways to Improve MQL Qualification Without Overcomplicating It As buying journeys become more complex, advanced qualification techniques help reduce ambiguity. Shift From Lead-Level to Account-Level Evaluation Individual engagement rarely captures the full buying picture. Account-level evaluation aggregates signals across stakeholders, revealing whether interest is isolated or collective. When multiple contacts engage while account-level intent increases, qualification confidence rises. This approach reflects how B2B decisions are actually made. Track Intent Momentum, Not Just Presence Intent is dynamic. Sudden increases in research activity often signal urgency, while steady low-level interest may indicate early exploration. Tracking intent velocity helps teams engage when interest peaks rather than reacting after momentum fades. B2B organizations using advanced buyer intent insights consistently outperform peers in revenue growth due to better timing and relevance. Segment MQLs by Readiness Stage Not all MQLs require the same response. Segmenting qualified leads by readiness allows teams to balance speed with buyer experience. High-intent leads move quickly to sales, while others receive targeted nurture that builds confidence over time. This approach reduces premature handoffs without slowing momentum. Use Sales Outcomes to Refine Qualification The most reliable feedback comes from what happens after handoff. Organizations that continuously refine lead qualification based on sales outcomes see improved

Content Syndication Pricing Models Explained: A Complete Guide for B2B Marketers

You just received the three proposals for content syndication services. Vendor A charges $75 per lead. Vendor B charges $40 CPM. Vendor C wants $15,000 monthly on a flat-fee retainer. We know each CPL (cost per lead), CPM (cost per thousand impressions), and flat fee in theory. But how do you compare the actual value? There is no apple-to-apple comparison. You are actually comparing apples to oranges – comparing things that are fundamentally different. B2B content syndication is complex, and the vendors aren’t always transparent. Hidden costs and wrong model selection can waste thousands of dollars. Worried about making a wrong call or being blamed for poor ROI? This blog will guide you to create a clear, unbiased framework for making the right choice. Why Pricing Transparency Matters: The Math That Changes Everything Let’s learn from the real-world scenario of why understanding the pricing is essential to defining your bottom line. Scenario: You have a $30,000 quarterly budget for content syndication. Your goal is to generate SQLs (Sales Qualified Leads) that convert to customers at a 15% close rate, with an average deal size of $25,000. Simple Content Syndication ROI Calculator (Template/Table) Peach Color Branded Table – Mobile Friendly Input Variable Option A (High-Quality CPL) Option B (Low-Cost CPL) Option C (Custom/Flat Fee/Other) Quarterly Budget ($) 30,000 30,000 Pricing Model $75/lead $30/lead (e.g., $15,000/mo flat fee) Expected # of Leads =Budget ÷ CPL = 400 =Budget ÷ CPL = 1,000 (Insert estimate or vendor data) % That Become SQLs 20% 5% # SQLs =Leads × SQL % = 80 =Leads × SQL % = 50 Sales Close Rate (%) 15% 15% Customers Closed =SQLs × Close Rate = 12 =SQLs × Close Rate = 7.5 Average Deal Size ($) 25,000 25,000 Total Revenue ($) =Customers × Deal Size = $300,000 =Customers × Deal Size = $187,500 It turns out the “expensive” $75 CPL vendor just generated $112,500 more revenue from the same budget because of superior lead quality. So yes, lower CPL is not always better. That is why understanding the pricing model is paramount. This blog breaks down 5 main content syndication pricing models to help you make the best choice to hit your ROI goals. The 5 Main Content Syndication Pricing Models Content syndication pricing models differ based on what you’re actually purchasing – leads, impressions, access, outcomes, or a combination. The five main models are: Each model shifts risk and reward differently between you and the vendor. Let’s explore how. Cost Per Lead (CPL) Model How It Works With the conventional CPL pricing model, you pay a fixed amount for each lead that meets the stipulated qualification criteria. The vendor distributes your content across multiple channels. You are only charged when someone engages and submits their information, provided that they satisfy criteria like job title, company size, and stated interest. It’s a “pay per result” model. Essentially, you are not paying for distribution; you’re paying for actual people who expressed interest in your content. Typical Price Ranges CPL pricing varies dramatically based on lead quality: Of course, the pricing spread exists because not all leads are the same. The value of someone randomly downloading a form is fundamentally different from an ICP researching your solutions. When CPL Makes Sense Qualified leads, as per the vendor, didn’t meet your ICP. This happens when qualification criteria are not clearly articulated. Here, you must have an established lead scoring process to make the most of the leads you receive. This model is ideal if you require budget predictability and have strong analytics in place, so the actual cost per customer isn’t visible until much later. However, quality varies vendor to vendor, even when they meet your stated criteria. The price per lead doesn’t automatically equal your cost per customer, and conversion rates vary significantly. CPL is particularly well-suited for modest volume needs, typically 100–500 leads per month. Cost Per Thousand Impressions (CPM) Model How It Works CPM pricing charges you for every 1,000 times your content is displayed to potential readers, regardless of whether they engage. You’re essentially paying for exposure rather than results, similar to traditional advertising. However, many marketers are wary of the CPM model because it puts performance risk on you. The vendor gets your content in front of the right audience; what happens next depends solely on your content quality and offer. Typical Price Ranges The cost depends heavily on audience specificity: Getting your content in front of 1,000 mid-level marketing managers is easier and cheaper than reaching 1,000 CFOs at Fortune 500 companies. When CPM Makes Sense CPM delivers maximum reach, making it excellent for brand awareness and top-of-funnel visibility. This model is good for testing content resonance before committing to more expensive lead-generation models. The downside is no guarantee of engagement. You pay even if no one converts. Also, ROI tracking is difficult because it’s hard to connect impressions to revenue. If you want broad awareness for a new product or have content designed for top-of-funnel engagement, this model is a sure shot. Let’s do the math: at $40 CPM with a $20,000 budget, you get 500,000 impressions. With a 2% engagement rate, that’s 10,000 downloads. If 5% submit forms, you’ve generated 500 leads at an effective CPL of $40. The economics work, provided your content converts at healthy rates. Flat Fee/Retainer Model How It Works You pay a fixed monthly or quarterly fee for a defined scope of syndication services. This typically includes content distribution, a minimum number of leads or impressions, detailed reporting, and strategic support like content optimization recommendations. The flat fee model transforms your vendor from a lead supplier into a strategic partner. Essentially, they are paid to deliver quality results because revenue depends on renewal, not volume targets. Typical Price Ranges Pricing scales with program complexity: These ranges reflect not just lead volume but also the level of service, strategic input, and partnership you’re receiving. When Flat Fee Makes Sense The flat fee model offers complete budget predictability.

SQL Metrics Every Sales Team Should Track

MQL to SQL is the golden bridge that connects marketing efforts to revenue. But this bridge is fragile and not easy to cross. It is the difference between scaling your business and burning through resources, from wasted sales time to inflated acquisition costs and missed opportunities. Many sales teams stumble because they do not fully understand where this bridge begins or ends. Crossing it successfully requires the right tactics, alignment, and collaboration between marketing and sales. Too often, sales teams fail to use the insights available at each stage of the funnel. Tracking SQL metrics is the most reliable way to assess lead quality, forecast revenue, and identify where your pipeline leaks or thrives. Companies that actively track SQL performance see 28% higher win rates and 33% more accurate revenue forecasts. By monitoring these key metrics, you can transform pipeline data into predictable growth. Defining an SQL The moment a lead is ready to hand off from marketing to sales, it becomes a Sales Qualified Lead (SQL). But that moment must be clearly defined. Typically, teams use qualification frameworks such as BANT (Budget, Authority, Need, Timeline) or advanced models like CHAMP or MEDDIC to evaluate readiness. An SQL generally meets the following criteria: This stage is critical. One wrong move can cost you a deal, but applying too many filters can leave too few leads to pursue. The key is finding the right balance between quality and quantity so that every SQL has both fit and intent. Key SQL Metrics Every Sales Team Should Track Once you have defined your SQL, the next step is to understand which metrics reveal true performance and efficiency across the pipeline. 1. MQL → SQL Conversion Rate This metric measures the percentage of Marketing Qualified Leads (MQLs) that become Sales Qualified Leads (SQLs). It directly reflects the alignment between marketing and sales. A low conversion rate often indicates weak targeting, poor lead scoring, or a lack of communication between teams. However, a high rate is only valuable if the leads are genuinely ready for sales. Slow-moving leads can create a false sense of pipeline health and waste valuable sales time. To improve this conversion rate: Formula: (SQLs ÷ Total MQLs) × 100% Example: If 500 MQLs are generated and 120 become SQLs, your conversion rate is 24%. Healthy B2B benchmarks range between 20% and 30%. 2. SQL → Opportunity Conversion Rate Once leads become SQLs, the next question is how many progress into genuine sales opportunities. This metric shows how effective your sales team is at nurturing SQLs and whether your qualification process is accurate. A low rate may indicate slow follow-ups, poor qualification, or missing context during handoff. If leads stall at this stage, they were likely not ready for sales or did not receive timely and relevant outreach. To improve this, track the average time from SQL to opportunity to uncover bottlenecks. Ensure sales reps have discovery notes and context at handoff so that their first contact is personalized and purposeful. Formula: (SQLs that become opportunities ÷ Total SQLs) × 100% Example: 120 SQLs → 30 opportunities → (30 ÷ 120) × 100% = 25%. Use CRM dashboards such as Salesforce or HubSpot to monitor performance by representative, region, or campaign. 3. SQL → Closed-Won Conversion Rate (SQL-to-Win) This is the ultimate success metric. It measures the percentage of SQLs that convert into paying customers. If SQL volume is strong but your win rate is low, your qualification process needs improvement. The goal is not to generate more SQLs but to generate better ones. Analyze win rates by source, sales representative, or campaign to identify which segments perform best. Use these insights to justify marketing spend and allocate resources strategically. Formula: (SQLs that became customers ÷ Total SQLs) × 100% Example: 120 SQLs → 18 closed-won deals → (18 ÷ 120) × 100% = 15%. Regular feedback between marketing and sales helps both teams refine targeting and qualification for continuous improvement. 4. SQL Velocity: Average Time to Opportunity and Close Velocity measures how quickly qualified leads move through the sales pipeline. You can track: Faster velocity shows efficient follow-ups and engaged buyers. Slow velocity indicates unclear ownership after handoff or weak engagement strategies. To improve velocity, set internal benchmarks for how long it should take to turn an SQL into an opportunity and from there to a closed deal. Identify and address outliers to maintain consistency. Sales Metrics Summary Metric Formula Example Avg Days SQL → Opportunity Total days from SQL to opportunity ÷ Number of SQLs converted 40 days Avg Days SQL → Close Total days from SQL to close ÷ Number of closed SQLs 90 days Velocity impacts both sales efficiency and the accuracy of revenue forecasting. 5. Average Deal Size and Pipeline Value from SQLs Not all SQLs are equal, and this metric helps identify the ones that truly impact your revenue. Track the average deal size and pipeline value from SQLs to understand which opportunities contribute most to your bottom line. Compare results across campaigns and channels to see which sources produce the largest deals and which slow down your pipeline. Average Deal Size: Total deal value from SQLs ÷ Number of closed deals Pipeline Value: Total value of opportunities generated from SQL-sourced deals This data helps prioritize high-quality SQLs that lead to larger, more predictable deals. 6. Lead Velocity Rate (LVR) for SQLs LVR measures the month-over-month growth in new SQLs. It is an early indicator of future pipeline strength but only valuable when quality keeps pace with volume. Track LVR alongside SQL-to-Win Rate and Average Deal Size. If LVR increases while these metrics decline, it means volume is growing at the expense of quality. Use intent data and predictive analytics to identify the segments most likely to convert successfully. Formula: (Current Month SQLs – Previous Month SQLs) ÷ Previous Month SQLs × 100% Example: April: 110 SQLs → May: 132 SQLs LVR = (132 – 110) ÷ 110 × 100% = 20%. Visualizing SQL Metrics:

Fast-track your revenue generation with Pay-for-Performance marketing campaigns.