

Your sales team may still struggle to find enough qualified opportunities even when paid search is running, LinkedIn campaigns are active, and content is being produced. The problem is not always how much you spend. It is whether the spending plan supports the pipeline the business needs.
Copying another company’s channel percentages can produce plenty of activity without a reliable path to revenue. A team with a six-month enterprise sales cycle should not fund channels in the same way as a business selling a lower-cost product to an established market.
Gartner’s 2026 CMO Spend Survey found that overall marketing budgets averaged 7.8% of company revenue among surveyed organizations, most of which reported annual revenue above $1 billion. That is context for marketing investment, not a recommended demand generation percentage for your company.
A useful B2B demand generation budget starts with revenue expectations, works backward through the sales funnel, and assigns each channel a specific job.
What Is B2B Demand Generation Budget Allocation?
B2B demand generation budget allocation is the process of deciding where funding goes across audiences, funnel stages, channels, campaigns, and measurement. It determines how much a company invests in creating demand, capturing existing interest, qualifying responses, and helping opportunities progress.
It is more than a list of channel costs. Paid search may capture people already evaluating a solution, while content and SEO build discoverability earlier in the buying process. Outbound reaches selected accounts directly. Webinars can help several stakeholders explore a complex problem.
A useful demand gen budget allocation model considers how these activities work together, rather than asking each channel to produce the same immediate result. For the broader operating model behind these decisions, see our demand generation framework.
Work Backward From Revenue and Pipeline Targets
Start with the new revenue the business expects to generate during a defined period. Then calculate the customers, opportunities, and pipeline required to support it.
- Customers required = New revenue target ÷ Average new-customer deal value
- Qualified opportunities required = Customers required ÷ Opportunity-to-win rate
- Required pipeline value = Qualified opportunities required × Average opportunity value
- Marketing-sourced opportunity target = Total required opportunities × Agreed marketing-sourced share
Consider an illustrative business targeting $1 million in new bookings over its planning period. Assume a $50,000 average new-customer deal value and a 25% opportunity-to-win rate.
| Calculation | Formula | Result |
|---|---|---|
| New customers | $1,000,000 ÷ $50,000 | 20 |
| Qualified opportunities | 20 ÷ 0.25 | 80 |
| Pipeline required | 80 × $50,000 | $4,000,000 |
| Marketing-sourced opportunities (60% assumed share) | 80 × 0.60 | 48 |
These are hypothetical assumptions, not Only-B2B performance figures or industry benchmarks. The model assumes the average opportunity value is close to the average won deal value, and it treats bookings and opportunity values consistently. If opportunity values, win rates, or revenue recognition differ, adjust the calculation.
Most importantly, distinguish marketing-sourced pipeline from marketing-influenced pipeline. A lead sourced by sales and later touched by a webinar should not automatically count as a new marketing-sourced opportunity.
Inputs Every Demand Generation Budget Model Needs
Before assigning spend, make the assumptions visible. Marketing, sales, and finance should agree on what is known, what is estimated, and who owns each input.
| Input | What to Record | Why It Matters |
|---|---|---|
| Revenue and pipeline target | Target, period, deal value and win rate | Sets the actual output requirement |
| CAC ceiling | Sustainable acquisition cost and payback | Protects unit economics |
| Sales cycle | Time from engagement to close | Sets realistic evaluation windows |
| Channel conversion | Lead, SQL, opportunity and customer rates | Connects spending with outcomes |
| Addressable market | Accounts, regions, personas and exclusions | Prevents unrealistic volume targets |
| Operating capacity | Team capacity and follow-up coverage | Makes campaign targets executable |
| Planning horizon | Near-term and long-term investment needs | Balances capture with future demand |
Sales capacity should be treated as a constraint, not an afterthought. Our SDR capacity planning guide explains why an account target means little without the time and effort needed to cover it properly.
Fixed Costs vs Variable Demand Generation Spend
A realistic marketing cost structure separates expenses needed to keep the program operating from costs that change with campaign volume.
- Fixed or relatively stable costs: Salaries, CRM and marketing automation, reporting tools, ongoing creative support, and base data subscriptions.
- Variable costs: Paid media, activity-based outsourced execution, content syndication charges, event sponsorships, and additional campaign production.
- Shared or mixed costs: Sales development labor, technology usage charges, enrichment, agency fees, and content creation may require an agreed allocation method.
Suppose one channel generates an $80 lead but requires substantial data cleanup and several sales attempts before qualification. Another produces a $160 lead that arrives with better fit and clearer buying context. Comparing media CPL alone excludes the work needed to turn both into opportunities.
Calculate a fully loaded program budget first. Then determine the campaign budget available after required people, technology, data, and follow-up costs. When comparing channels, include the same cost categories and measurement windows in each calculation.
How to Allocate Budget Across the Funnel
Fund funnel stages according to the job that is currently under-resourced, not a universal percentage template.
- Demand creation: Educational content, organic visibility, brand building, and relevant audience engagement help future buyers understand a problem.
- Demand capture: Paid search, high-intent landing pages, and conversion paths reach people actively researching solutions.
- Qualification: Enrichment, validation, lead scoring, and follow-up identify whether a response matches the ideal customer profile.
- Pipeline acceleration: Account-focused content, webinars, stakeholder outreach, and sales enablement help active opportunities progress.
- Measurement: CRM definitions, tracking, attribution, and cohort reporting reveal which investments contribute to pipeline.
The LinkedIn B2B Institute’s research on the 95-5 rule offers a useful reminder that many potential B2B buyers are not actively purchasing at any one time. The figure is a generalized research principle, not a company-specific budget split. A business entering a category may need more demand creation; a company with strong awareness but weak conversions may need better qualification and capture.
The right funding mix changes with funnel constraints. A B2B sales funnel helps make those constraints visible before more spend is approved.
Match Each Channel to the Job It Must Perform
Different demand generation channels have different jobs and time horizons. Compare them on fit, execution capacity, and downstream quality, not just the speed at which a dashboard reports clicks.
| Channel | Evidence to Check | Reason to Delay Scaling |
|---|---|---|
| SEO & Content | Relevant search visibility, qualified organic inquiries and assisted opportunities | Traffic growth comes mainly from queries unrelated to the ICP |
| Paid Search | Search intent, cost per qualified opportunity and available search volume | Rising costs without comparable opportunity quality |
| ICP engagement, accepted leads and account progression | Engagement increases but qualified responses remain weak | |
| Content Syndication | Lead acceptance, duplicate rate, SQL conversion and meeting outcomes | Lead volume rises while acceptance or meeting conversion falls |
| Webinars | Relevant attendance, follow-up completion and influenced opportunities | Engaged attendees are not receiving timely follow-up |
| ABM | Target-account coverage, buying-group engagement and opportunity movement | Target accounts lack sufficient fit or sales coordination |
| Outbound | Positive reply quality, meetings held and opportunities created | Poor data quality or insufficient SDR follow-up capacity |
| Partners | Qualified referrals, sourced pipeline and partner execution consistency | Unclear ownership or insufficient referral quality |
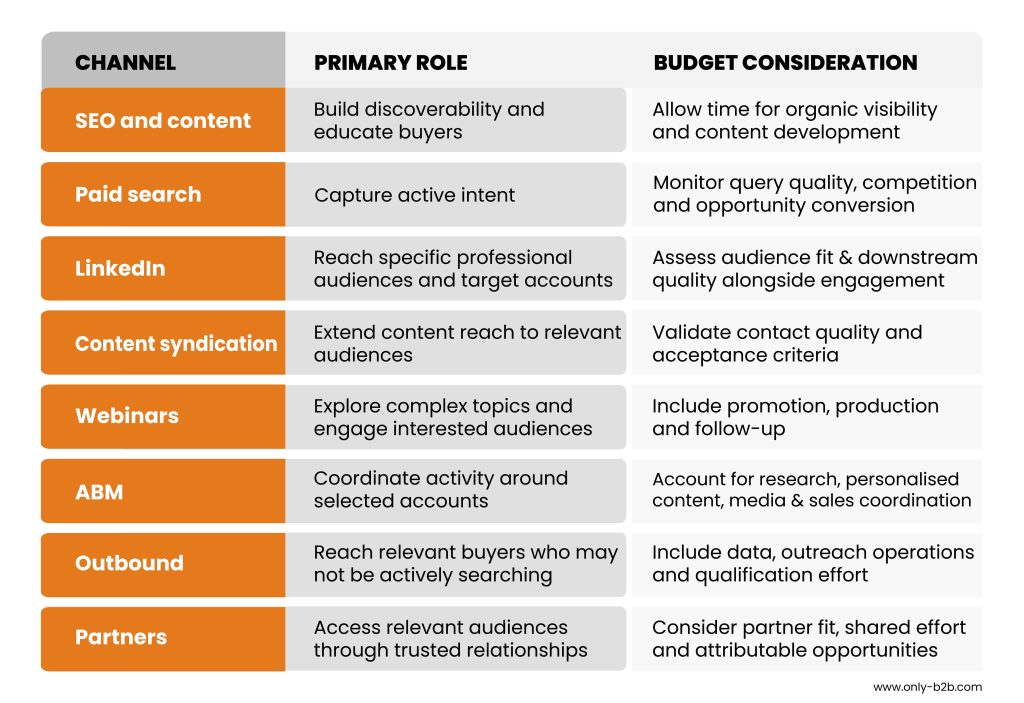
These indicators help teams decide whether a channel deserves additional investment. Before increasing spend, confirm that the channel is producing relevant demand, downstream conversion is improving, and sales can manage the additional opportunities. The infographic below summarizes each channel’s role and the budget considerations that shape its contribution.
For deeper execution detail, see our content syndication strategies and account-based marketing framework articles.
Compare Channels Using Downstream Unit Economics
Cost per lead measures the price of an initial response. It does not show what a qualified opportunity or new customer ultimately costs.
- CPL = Relevant channel spend ÷ Leads generated
- Cost per accepted lead = Relevant spend ÷ Leads accepted against agreed criteria
- Cost per SQL = Relevant spend ÷ Sales-qualified leads
- Cost per opportunity = Relevant spend ÷ Qualified opportunities created
- CAC = Fully loaded sales and marketing acquisition spend ÷ New customers acquired
- Pipeline-to-spend ratio = Qualified sourced pipeline value ÷ Relevant spend
Consider two hypothetical campaigns with the same lead definition and cost basis. Channel A produces leads at $80 each, and 5% become opportunities. Channel B produces leads at $160 each, and 20% become opportunities.
| Metric | Channel A | Channel B |
|---|---|---|
| Cost per Lead | $80 | $160 |
| Lead-to-Opportunity Rate | 5% | 20% |
| Cost per Opportunity | $1,600 | $800 |
Although Channel B has twice the CPL, it creates opportunities at half the cost in this example. That does not automatically make it the better long-term investment; deal size, win rate, margin, time to close, and available audience still matter.
Use consistent conversion definitions across campaigns. Our B2B conversion metrics guide explains the key funnel transitions and formulas.
Budget Scenario 1: Emerging B2B Team
An emerging team needs to learn which audiences, offers, and acquisition routes produce qualified conversations. Spreading a small budget across every channel usually makes those lessons harder to interpret.
Illustrative assumptions: $10,000 monthly campaign and testing budget after baseline salaries and core software; a small team with limited SDR follow-up capacity; uncertain historical conversion data; priority on early pipeline and learning. The allocations below are not industry averages.
| Investment Area | Share | Monthly Spend |
|---|---|---|
| Paid search and high-intent capture | 25% | $2,500 |
| Content and organic visibility | 20% | $2,000 |
| LinkedIn audience testing | 15% | $1,500 |
| Outbound and data quality | 20% | $2,000 |
| Webinar or syndication pilot | 10% | $1,000 |
| Measurement and testing reserve | 10% | $1,000 |
| Total | 100% | $10,000 |
The team should actively run only the tests it can measure and follow up. If LinkedIn creates engagement but few qualified responses, investigate audience and offer fit before shifting the whole budget. If high-intent search produces opportunities within an acceptable cost range, scale only while relevant search demand and sales capacity allow.
Budget Scenario 2: Mid-Market Growth Team
A mid-market team may already have an established content program, reliable historical conversion data, and several sources of pipeline. Its challenge is balancing current capture with future demand.
Illustrative assumptions: $50,000 monthly campaign and testing budget after stable core operating costs; dedicated marketing operations and sales-development owners; enough CRM history to compare cohorts; capacity to operate several coordinated campaigns.
| Investment Area | Share | Monthly Spend |
|---|---|---|
| SEO and content | 20% | $10,000 |
| Paid search and LinkedIn | 25% | $12,500 |
| Content syndication | 15% | $7,500 |
| Webinars and account programs | 15% | $7,500 |
| Outbound and data operations | 15% | $7,500 |
| Measurement and testing | 10% | $5,000 |
| Total | 100% | $50,000 |
The team must have someone to own creative, campaign operations, sales acceptance, and reporting for each active motion. For example, investing more in syndication while acceptance rates are falling will only increase downstream workload. Fix targeting or lead criteria first. If opportunities stall later in the funnel, allocate more to account content and follow-up rather than buying additional leads.
Budget Scenario 3: Enterprise Demand Generation
Enterprise buying often involves multiple stakeholders, complex approvals, high-value accounts, and long sales cycles. A budget focused only on immediate leads may underfund the work needed to progress an account.
Illustrative assumptions: $200,000 monthly campaign and testing budget, excluding baseline permanent headcount and core technology; a defined named-account list; dedicated sales and marketing coordination; opportunity reporting evaluated over a longer buying cycle.
| Investment Area | Share | Monthly Spend |
|---|---|---|
| Named-account programs and ABM | 25% | $50,000 |
| Content and thought leadership | 20% | $40,000 |
| Paid media and intent-based targeting | 15% | $30,000 |
| Events and executive engagement | 15% | $30,000 |
| Sales development and account coordination | 15% | $30,000 |
| Measurement and testing | 10% | $20,000 |
| Total | 100% | $200,000 |
This allocation prioritizes named-account coverage rather than isolated lead targets. Intent data can help prioritize research, but it is not proof that an account is ready to buy. The team still needs to validate fit, engage the right stakeholders, and coordinate outreach. Evaluate account engagement and opportunity progression alongside the direct revenue outcome.
When and How to Reallocate Demand Generation Budget
Review spend on a consistent cadence, but change allocations when evidence is reliable enough to justify it. A monthly operating review can catch tracking or qualification problems. A quarterly allocation review is useful for larger funding decisions, subject to sales cycle and campaign volume.
- Scale: Increase funding when a channel repeatedly creates qualified opportunities within an acceptable cost range, with sufficient market demand and follow-up capacity.
- Reduce: Lower investment when downstream quality weakens or fully loaded opportunity costs exceed the agreed ceiling after a meaningful measurement window.
- Pause: Stop or limit a campaign when tracking fails, required exclusions are missing, or invalid records make outcomes unreliable.
- Redesign: Keep the channel under review but change targeting, offer, landing page, qualification, or follow-up when the right buyers are engaging but not progressing.
For example, a paid program with poor lead acceptance should not be scaled merely because CPL improved. Conversely, a new SEO initiative should not be cancelled after one month just because no opportunities have closed. Establish expected learning signals, minimum review windows, and ownership before launch.
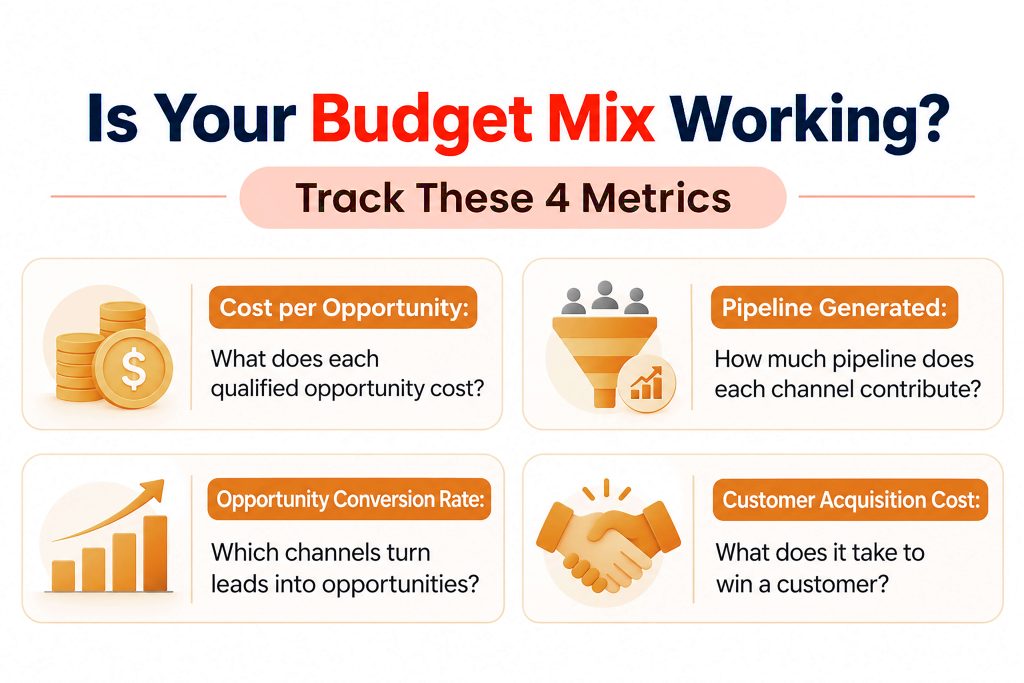
How to Measure Whether the Budget Mix Is Working
Connect leading indicators to accepted demand, pipeline, and customers. The stages should not be treated as interchangeable.
- Early signals: Relevant account reach, search intent, meaningful engagement, form responses, and meeting requests.
- Qualification: Accepted leads, rejected leads, SQLs, response time, and source quality.
- Pipeline: Qualified opportunities, opportunity value, cost per opportunity, stage progression, and pipeline-to-spend.
- Commercial outcomes: Closed-won revenue, CAC, gross-margin contribution, and payback.
Measure cohorts by the month or quarter they entered the funnel, then examine how they progress over time. A lead acquired this month might become an opportunity next quarter and a customer later. Compare similar-aged cohorts so longer-cycle channels are not penalized unfairly.
Also agree on attribution rules. Google Analytics documentation explains that different attribution models assign credit to touchpoints differently. GA4 website attribution should be considered alongside CRM opportunity ownership; web-event attribution alone cannot establish which channel sourced an enterprise deal.
Make acceptance rules visible in the CRM. Our MQL-to-SQL handoff SLA guide covers the definitions, ownership, and feedback process needed to make source-quality reporting meaningful.
Common Demand Generation Budget Mistakes
- Choosing channels before pipeline goals. Fix: Define required opportunities and sources of pipeline before percentages.
- Comparing media spend instead of full costs. Fix: Include people, technology, data, enrichment and follow-up.
- Cutting a program too early. Fix: Set a review window that fits the sales cycle and the channel’s job.
- Buying more demand than sales can manage. Fix: Match target volume to qualification and follow-up capacity.
- Optimizing only for cheap leads. Fix: Compare accepted leads, opportunities, CAC, and deal quality.
- Copying competitors’ channel percentages. Fix: Build around your market, buying process and evidence.
- Leaving no room for testing. Fix: Reserve a defined learning budget with clear success criteria.
FAQs on B2B Demand Generation Budgets
How much should a B2B company spend on demand generation?
There is no universal amount. Work backward from your revenue target, deal economics, win rates, acquisition costs, and sales capacity. Overall marketing-spend benchmarks are context, not a substitute for a company-specific demand generation model.
What is a good channel allocation for B2B marketing?
The best split depends on whether your immediate constraint is awareness, active demand, lead qualification, or opportunity progression. Use the scenario tables as hypotheses and adjust based on your own downstream conversion evidence.
Should teams prioritize lead generation or demand creation?
Most B2B programs need both. Demand capture converts existing intent; demand creation helps future buyers become familiar with the category and your offering. The balance depends on how many buyers are already in-market and how quickly revenue is needed.
Is the channel with the lowest CPL usually the best investment?
No. A low CPL can conceal weak sales acceptance, low opportunity conversion, or expensive follow-up. Compare fully loaded cost per opportunity and CAC using consistent definitions.
How much budget should be reserved for testing?
Reserve enough to run meaningful tests without putting essential programs at risk. The illustrative scenarios use a 10% measurement and testing line, but that is not a universal benchmark. Separate required analytics costs from the amount actually available for experiments.
How long should a team wait before reallocating spend?
Review operational quality frequently, but make major allocations only after enough time and volume are available to evaluate the intended outcomes. Use the sales cycle and expected signal window for each channel.
Should staff salaries and technology be included in the demand gen budget?
Yes, when assessing the full cost of generating customers. For campaign-mix planning, you can show campaign spending separately, provided stable operating expenses are explicitly documented and not quietly excluded from CAC.
Define marketing-sourced, sales-sourced, partner-sourced, and marketing-influenced pipeline separately. Agree on stage definitions, attribution, and handoff ownership in the CRM so contributions are not double-counted.
Allocate Budget Around Pipeline, Not Channel Popularity
A strong B2B demand generation budget starts with the revenue goal, identifies where the funnel is constrained, and funds the work most likely to address that constraint. Channel mix matters, but it only works when spending assumptions, sales capacity, measurement, and follow-up fit together.
The right allocation will change as your market, sales cycle, and performance evidence change. What should remain consistent is the connection between investment and qualified opportunities.
Need a demand generation plan built around qualified pipeline rather than lead volume? Explore Only-B2B’s B2B lead generation and demand generation solutions to discuss targeting, campaign execution, lead qualification, and pipeline growth.

Vikas Bhatt is the Co-Founder of ONLY B2B, a premium B2B lead generation company that specializes in helping businesses achieve their growth objectives through targeted marketing & sales campaigns. With 10+ years of experience in the industry, Vikas has a deep understanding of the challenges faced by businesses today and has developed a unique approach to lead generation that has helped clients across a range of industries around the globe. As a thought leader in the B2B marketing community, ONLY B2B specializes in demand generation, content syndication, database services and more.