

B2B conversion metrics show how effectively prospects move through your funnel, from visitor and lead to MQL, SQL, opportunity, customer, and expansion. Tracking these metrics helps marketing and sales teams identify where conversion rates drop, which channels create qualified pipeline, and where potential revenue is being lost.
Unlike surface-level activity metrics, B2B funnel metrics connect marketing, sales, and customer success performance to measurable business outcomes. This becomes especially important when sales cycles are longer and multiple stakeholders are involved, because weak qualification, handoffs, or follow-up at any stage can reduce overall conversion performance.
In this guide, we break down the B2B conversion metrics to track in 2026, including funnel conversion rates, cost and ROI KPIs, campaign metrics, ABM and retention metrics, formulas, examples, and practical benchmarks to help you identify funnel leaks and improve revenue performance.
What Are Conversion Metrics and Why They Matter
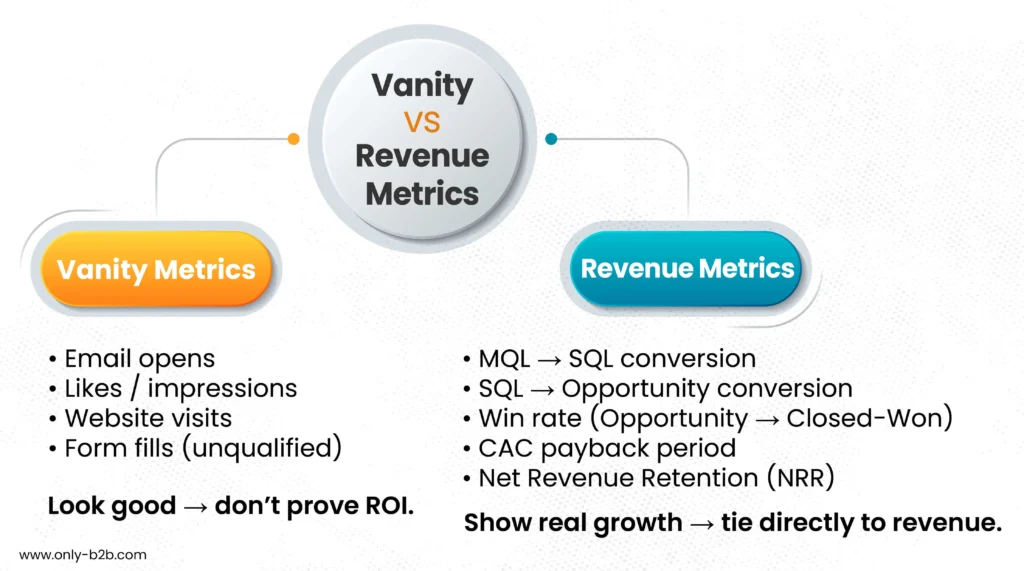
B2B conversion metrics measure how effectively prospects, opportunities, and customers move from one defined stage or action to the next. Instead of looking only at activity such as clicks, downloads, or form fills, these metrics show whether that activity is actually progressing toward pipeline, revenue, retention, or expansion.
Common B2B conversions include:
- An anonymous website visitor becoming a lead
- A marketing-qualified lead becoming an SQL
- An SQL progressing to an opportunity
- An opportunity becoming a closed-won customer
- An existing customer renewing, upselling, or expanding
Tracking these stage-to-stage conversions helps marketing, sales, and customer success teams identify funnel leaks, compare performance across channels and segments, and understand which activities are actually contributing to revenue. A healthy top-of-funnel volume means little if prospects consistently drop at qualification, opportunity creation, or close.
Funnel Conversion Metrics You Should Be Tracking
B2B funnel conversion metrics measure the percentage of prospects that successfully progress from one stage of the buying journey to the next. Looking only at the final lead-to-customer conversion rate can hide where performance is actually breaking down, so each major funnel transition should be measured separately.
At a minimum, B2B teams should monitor Lead → Customer, MQL → SQL, SQL → Opportunity, and Opportunity → Closed-Won conversion rates. Comparing these stage-level metrics over time, by source, segment, and campaign helps reveal where qualified prospects are dropping out and where improvements can have the greatest impact on pipeline and revenue.
Lead → Customer Conversion Rate
Leads may be climbing fast, but if revenue is not, there is a gap between attention and outcomes. “More leads” does not mean more growth. In fact, it magnifies waste if handoffs, qualification, or sales follow-through are broken.
The key is to track this rate by cohort (month, industry, company size, region, or campaign) and source (Google Ads, LinkedIn, webinars, referrals, content syndication, etc.). This reveals which channels drive intent, and which only create noise.
Formula: Lead → Customer = (Customers ÷ Leads) × 100
Example: Campaign A: 5,000 leads → 100 customers = 2%. Campaign B: 1,000 leads → 50 customers = 5%.
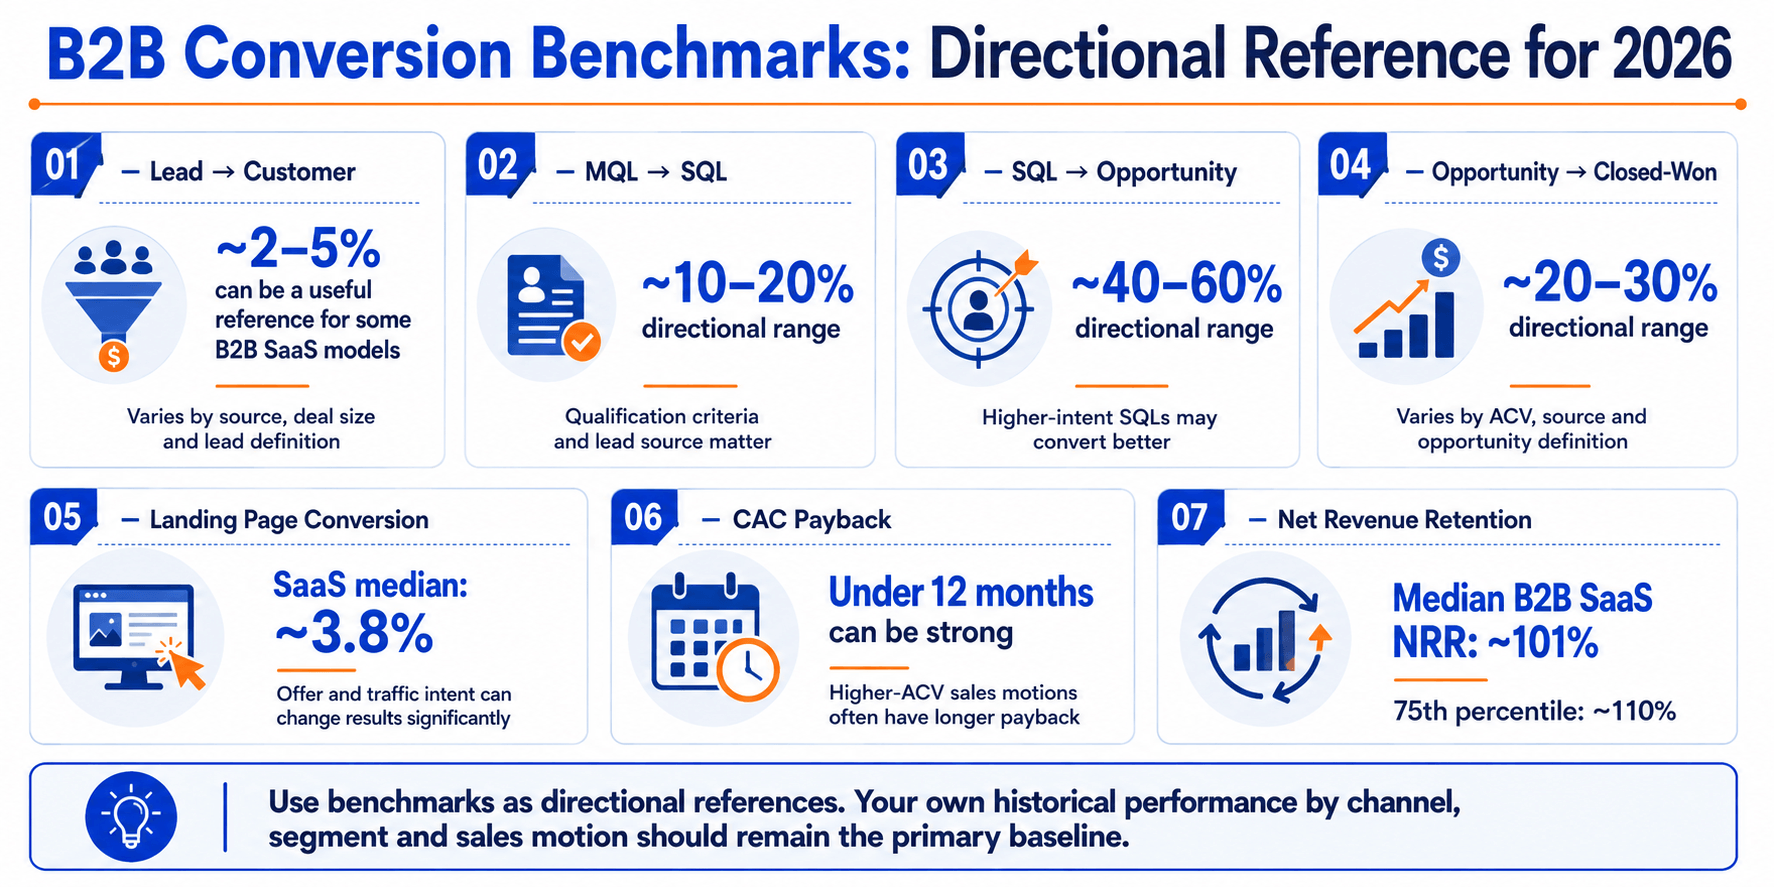
Directional benchmark: Overall lead-to-customer conversion varies significantly by lead definition, deal size, source, and sales motion. A roughly 2–5% range can be useful for some B2B SaaS models, but your own cohort and channel performance should be the primary benchmark.
Tools: HubSpot or Salesforce for stage tracking; Tableau/Power BI for source and cohort analysis.
MQL → SQL Conversion Rate
MQL → SQL conversion rate shows how effectively marketing-qualified leads are being accepted and progressed by sales. A weak rate can point to loose MQL criteria, poor ICP fit, slow follow-up, or disagreement between marketing and sales about what qualifies as sales-ready.
A stronger rate usually indicates better alignment between qualification criteria, lead scoring, timing, and ICP fit.
Formula: MQL → SQL = (SQLs ÷ MQLs) × 100
Example: 400 MQLs → 80 SQLs = 20%.
Directional benchmark: MQL-to-SQL conversion varies by industry, lead source, qualification criteria, and sales motion. A 10–20% range is a useful directional reference for many B2B teams, but your own historical, channel-level, and segment-level performance should remain the primary benchmark.
Tools: Marketo, Pardot, or HubSpot for lead scoring; Salesforce for acceptance tracking.
SQL → Opportunity Conversion Rate
SQL → Opportunity conversion rate measures how effectively sales-qualified leads progress into active pipeline opportunities. This stage is especially useful for evaluating whether qualification criteria, discovery conversations, and the SDR-to-AE handoff are working as intended.
A weak rate may indicate that SQLs are being created too early, qualification criteria are too loose, or discovery is failing to confirm a meaningful business need, urgency, stakeholder alignment, or buying timeline.
Formula: SQL → Opportunity = (Opportunities ÷ SQLs) × 100
Example: 100 SQLs → 45 opportunities = 45%.
Directional benchmark: SQL-to-opportunity conversion varies by lead source, deal size, qualification model, and sales motion. A roughly 40–60% range can be a useful reference for many B2B teams, with higher-intent inbound SQLs often converting better than outbound-sourced SQLs.
Tools: Salesforce or Pipedrive for stage definitions and pipeline tracking; Clari for identifying where qualified deals stall.
Opportunity → Closed-Won Rate
Opportunity → Closed-Won rate measures the percentage of qualified sales opportunities that become customers. It is one of the clearest indicators of whether your qualification, positioning, competitive differentiation, pricing, and sales execution are turning pipeline into revenue.
A weak win rate does not always mean the closing team is the problem. It can also indicate poor opportunity qualification, weak business cases, misaligned stakeholders, competitive pressure, or deals entering the pipeline before genuine buying intent exists.
Formula: Opportunity → Closed-Won = (Closed-Won Deals ÷ Opportunities) × 100
Example: 80 qualified opportunities → 20 customers = 25%.
Directional benchmark: Qualified B2B SaaS opportunity-to-closed-won rates commonly fall around 20–30%, although performance varies substantially by deal size, lead source, market maturity, and how strictly an “opportunity” is defined. Your own win rate by segment and source should remain the primary benchmark.
Tools: Salesforce or HubSpot for opportunity-stage tracking; Gong or Clari for analyzing deal progression, losses, and forecast risk.
Cost & ROI Metrics
Cost per Lead (CPL)
Cost per Lead (CPL) measures how much you spend to generate a lead from a specific channel, campaign, or program. A lower CPL can look efficient, but it does not necessarily mean the channel is producing better pipeline or revenue.
CPL should be evaluated alongside lead quality and downstream conversion metrics such as MQL, SQL, opportunity, and customer conversion rates. A channel with a higher CPL can still be more efficient if it generates a greater share of qualified and sales-ready leads.
Formula: CPL = Total Campaign or Channel Spend ÷ Number of Leads Generated
Example:
- Channel A: $5,000 spend → 500 leads = $10 CPL → 25 SQLs = $200 per SQL
- Channel B: $5,000 spend → 100 leads = $50 CPL → 40 SQLs = $125 per SQL
Interpretation: Channel A generates cheaper leads, but Channel B produces qualified pipeline more efficiently. This is why CPL should be analyzed together with cost per qualified lead, pipeline contribution, and customer acquisition cost rather than optimized in isolation.
Directional benchmark: CPL varies significantly by industry, channel, targeting, geography, and lead definition. Recent HubSpot benchmark data places average B2B CPL at roughly $84 across channels, while B2B SaaS can be substantially higher, so your own channel-level cost and downstream conversion performance should remain the primary benchmark.
Tools: GA4 and campaign tracking for attribution; HubSpot, Marketo, or your CRM to connect lead source with qualification and pipeline.
Customer Acquisition Cost (CAC) & Payback
Customer Acquisition Cost (CAC) measures the total sales and marketing cost required to acquire a new customer. Unlike CPL, CAC looks further down the funnel and shows how efficiently your acquisition investment turns into actual customers.
CAC payback period measures how long it takes to recover that acquisition cost from the gross profit generated by a customer. A shorter payback generally improves cash efficiency, but the right target depends heavily on annual contract value, gross margin, sales complexity, and go-to-market motion.
Formula: CAC = Total Sales & Marketing Acquisition Spend ÷ New Customers Acquired
CAC Payback: CAC ÷ Monthly Gross Profit per Customer
Example: $120,000 in acquisition spend ÷ 60 new customers = $2,000 CAC. If each customer generates $500 in monthly gross profit, CAC payback = 4 months.
Directional benchmark: A payback period below 12 months is generally considered strong for SaaS, but it should not be treated as a universal target. Current B2B SaaS benchmark data shows CAC payback varies substantially by ACV, with longer payback periods common in higher-value, sales-led enterprise motions.
Tools: CRM and finance/BI systems for CAC and payback modeling; marketing automation and attribution data to connect acquisition costs with customers and revenue.
Lifetime Value (LTV) and the LTV:CAC Ratio
Customer Lifetime Value (LTV) estimates the gross profit a customer is expected to generate over the duration of the relationship. Comparing LTV with Customer Acquisition Cost (CAC) helps determine whether the value created by a customer justifies what you spend to acquire them.
The LTV:CAC ratio should be evaluated alongside CAC payback, retention, gross margin, and expansion because a strong-looking ratio can still hide slow cash recovery or overly optimistic lifetime-value assumptions.
Formula (SaaS-style): LTV ≈ (ARPA × Gross Margin %) ÷ Customer Churn Rate
LTV:CAC Ratio: LTV ÷ CAC
Example: $10,000 annual ARPA × 70% gross margin ÷ 10% annual churn = $70,000 LTV. With $20,000 CAC, the LTV:CAC ratio = 3.5:1.
Directional benchmark: An LTV:CAC ratio around 3:1 or higher is commonly used as a healthy SaaS reference point, but it should not be treated as a universal target. Ratios vary by growth stage, customer segment, sales motion, retention profile, and how LTV and CAC are calculated. Very high ratios can also indicate that a company may be underinvesting in customer acquisition.
Tools: CRM and billing systems for customer revenue and acquisition data; finance or BI tools for gross-margin, churn, LTV, and CAC analysis.
Content & Campaign Conversion Metrics
Landing Page Conversion Rate
Landing page conversion rate measures the percentage of visitors who complete the primary action on a landing page, such as submitting a form, requesting a demo, downloading an asset, or registering for an event. It helps show whether the page, offer, traffic source, and CTA are aligned with visitor intent.
Formula: Landing Page Conversion Rate = (Conversions ÷ Landing Page Visitors) × 100
Example: 2,000 landing page visitors → 80 conversions = 4% conversion rate.
Directional benchmark: Landing page conversion rates vary widely by industry, offer, traffic source, audience intent, and conversion action. Unbounce reports a median of 6.6% across all industries and about 3.8% for SaaS landing pages, so B2B teams should avoid treating one universal percentage as “good.” Compare performance primarily against your own page type, traffic source, and historical baseline.
Tools: GA4 for conversion and traffic analysis; your CRM or marketing automation platform to evaluate whether landing-page conversions progress into qualified pipeline.
Gated Content → Lead → Pipeline
Gated content conversions measure what happens after someone exchanges their information for an asset such as an eBook, report, checklist, or whitepaper. A download shows interest, but it does not automatically indicate buying readiness. The more useful question is how many content conversions become qualified leads and eventually contribute to pipeline.
Teams should evaluate gated-content performance in stages: download → qualified lead → sales conversation → opportunity. If large download volumes produce very few qualified prospects, review audience targeting, content relevance, qualification criteria, and follow-up before increasing campaign spend.
Formula: Qualified Lead Rate = (Qualified Leads ÷ Content Downloads) × 100
Pipeline Creation Rate: (Opportunities ÷ Content Downloads) × 100
Example: 1,000 downloads → 250 qualified leads = 25% qualified lead rate → 50 opportunities = 5% pipeline creation rate.
Directional benchmark: There is no reliable universal benchmark for gated-content-to-pipeline conversion because performance changes substantially by asset type, traffic source, ICP targeting, form requirements, and qualification model. Benchmark each asset primarily against your own historical qualified-lead and opportunity conversion rates.
Tools: Marketing automation for form capture, enrichment, scoring, and nurture; CRM for tracking qualified leads through opportunity creation.
Webinar/Demo → SQL
Webinars and demos can both generate high-intent engagement, but they should be measured separately. A webinar attendee may still be researching a problem or solution, while someone requesting a product demo is usually demonstrating stronger buying intent.
For stronger webinar lead generation, track the progression from attendee → MQL → SQL rather than treating attendance itself as a sales-ready conversion. Engagement signals such as questions asked, poll responses, session duration, content downloads, and post-event activity can help identify which attendees deserve faster follow-up.
Formula: Webinar Attendee → SQL = (SQLs ÷ Webinar Attendees) × 100
Example: 150 attendees → 45 MQLs → 12 SQLs = 8% attendee-to-SQL conversion.
Directional benchmark: Webinar conversion varies heavily by topic, audience quality, engagement, and qualification criteria. One 2026 B2B webinar benchmark study reported approximately 38.2% live attendee → MQL and 16.4% webinar-sourced MQL → SQL. Treat these as directional references and use your own attendee-to-SQL performance by webinar type and audience segment as the primary benchmark.
Tools: Webinar platforms such as ON24 for attendance and engagement data; marketing automation and CRM systems to connect attendees with MQL, SQL, opportunity, and revenue outcomes.
ABM Conversion Metrics
Account Engagement Score
Account engagement score combines meaningful activity from people within a target account to show whether interest is expanding across the buying group. Depending on your scoring model, signals can include high-intent page visits, content engagement, event participation, email activity, intent signals, and interactions from multiple stakeholders.
Breadth matters as much as activity volume. One highly active contact can create a strong-looking score without proving that the wider buying group is engaged. Multiple relevant stakeholders showing meaningful activity usually provides a stronger account-level signal.
Example: Account A has one contact completing 20 activities. Account B has four relevant stakeholders completing five meaningful activities each. Even though total activity is identical, Account B shows broader buying-group engagement and may represent the healthier opportunity.
Directional benchmark: There is no universal “good” account engagement score because platforms use different signals, weights, time windows, and scoring models. Establish your own thresholds by comparing engagement patterns with historical opportunity creation, stage progression, and closed-won accounts.
Tools: Demandbase, 6sense, or similar ABM platforms for account-level engagement scoring; CRM data to connect engagement with opportunity and revenue outcomes.
Pipeline Influence & Stage Progress
When evaluating an ABM strategy pipeline influence measures how much active pipeline has been associated with ABM engagement, while stage progress shows whether target accounts are actually moving forward through the buying journey. Both matter because a campaign can touch a large amount of pipeline without necessarily causing that pipeline to advance.
To avoid overstating ABM impact, evaluate influenced pipeline alongside opportunity creation, stage movement, deal velocity, and closed-won outcomes. Accounts that receive meaningful ABM engagement and then progress from early-stage interest to qualified opportunity provide a stronger signal than pipeline that was merely exposed to a campaign.
Pipeline Influence Formula: Influenced Pipeline % = (Pipeline Value Associated With ABM-Engaged Accounts ÷ Total Pipeline Value) × 100
Stage Progression Formula: Stage Progression Rate = (Target Accounts Advancing to the Next Stage ÷ Target Accounts in the Starting Stage) × 100
Example: $4M total pipeline → $2M associated with ABM-engaged accounts = 50% influenced pipeline. If 40 target accounts begin in an evaluation stage and 12 progress to opportunity, stage progression = 30%.
Interpretation: A high influenced-pipeline percentage is useful, but it becomes more meaningful when ABM-engaged accounts also create opportunities, advance stages, or close at stronger rates than comparable accounts.
Tools: Demandbase, 6sense, or similar ABM platforms for account engagement and journey-stage analysis; CRM data for opportunity creation, stage progression, pipeline, and revenue attribution.
Buying Committee Coverage
Buying committee coverage measures how many of the stakeholder roles required for a purchase have been identified and meaningfully engaged. It helps reveal whether an opportunity is genuinely multi-threaded or overly dependent on a single champion.
Coverage should consider roles, not just contact count. Depending on the deal, the buying group may include a champion, economic buyer, technical evaluator, end user, executive sponsor, procurement, finance, legal, or security. Recent 6sense research shows that modern B2B buying groups often involve around 10 people, reinforcing why single-contact engagement creates risk in complex deals.
Formula: Buying Committee Coverage = (Engaged Required Roles ÷ Total Required Roles) × 100
Example: If an opportunity requires six stakeholder roles and meaningful engagement exists with four of them, buying committee coverage = 67%.
Directional benchmark: There is no universal “healthy” coverage percentage. Build your benchmark by comparing stakeholder coverage in historical closed-won opportunities against lost or stalled deals. As opportunities progress, coverage should generally expand to include the roles required for evaluation, approval, procurement, and implementation.
Tools: CRM opportunity-contact roles for stakeholder mapping; sales intelligence, conversation intelligence, and intent data for identifying missing or newly active members of the buying group.
Retention & Expansion Conversion Metrics
Renewal Rate
Renewal rate measures the percentage of customer contracts that renew when they reach the end of their term. It is especially useful for annual and multi-year B2B contracts because it focuses only on customers who were actually eligible to renew during the period.
Track renewal rate by both customer count and contract value. Logo renewal shows how many customers stayed, while dollar renewal shows how much recurring revenue was retained from the contracts that came up for renewal.
Formula: Logo Renewal Rate = (Contracts Renewed ÷ Contracts Up for Renewal) × 100
Dollar Renewal Rate: (Renewed Contract Value ÷ Contract Value Up for Renewal) × 100
Example: 100 contracts come up for renewal → 90 renew = 90% logo renewal rate. If those renewing contracts retain $900,000 from $1 million of renewable contract value, dollar renewal rate = 90%.
Directional benchmark: Renewal performance varies by customer segment, ACV, contract structure, product maturity, and switching costs. A roughly 85–95% annual gross renewal range can be a useful directional reference for B2B SaaS, but enterprise and higher-ACV contracts may behave differently. Current retention research also reinforces that benchmarks should be segmented rather than treated as universal.
Tools: CRM and subscription or billing systems for renewal dates and contract value; customer-success platforms for health signals and renewal-risk monitoring.
Upsell & Cross-Sell Conversion
Upsell and cross-sell conversion measures how effectively existing customers move into a higher-value plan, add seats, purchase additional products, or expand into new teams or use cases. These opportunities are strongest when expansion is tied to clear customer outcomes, product usage, or changing business needs rather than generic sales outreach.
Track upsell and cross-sell against the customers who were actually eligible or approached for expansion. Looking only at total customer count can hide whether your expansion motion is working with the right accounts.
Formula: Expansion Conversion Rate = (Customers That Expanded ÷ Eligible or Approached Customers) × 100
Example: 200 eligible customers → 40 expand through an upsell or cross-sell = 20% expansion conversion rate.
Directional benchmark: There is no universal SaaS upsell or cross-sell conversion benchmark because expansion models differ significantly. Recent SaaS data shows expansion revenue is becoming a larger contributor to new ARR, while actual account-level upsell and cross-sell rates vary substantially by product, ACV, customer maturity, and expansion trigger. Benchmark performance primarily against your own eligible-account cohorts and expansion revenue trends.
Tools: CRM and customer-success platforms for expansion opportunities and account ownership; product analytics and billing systems for usage, plan limits, seat growth, and expansion revenue.
Net Revenue Retention (NRR)
Net Revenue Retention (NRR) measures how much recurring revenue you retain from an existing customer cohort after accounting for expansion, contraction, and churn. It shows whether your existing customer base is growing, shrinking, or staying roughly flat without including revenue from newly acquired customers.
An NRR above 100% means expansion revenue from existing customers is more than offsetting churn and contraction. An NRR below 100% means the existing customer base is shrinking on a net basis.
Formula: NRR = (Starting Recurring Revenue + Expansion Revenue – Contraction Revenue – Churned Revenue) ÷ Starting Recurring Revenue × 100
Example: Start with $1M in recurring revenue → lose $200K to churn and contraction → gain $300K in expansion = 110% NRR.
Directional benchmark: Recent Benchmarkit data places median private B2B SaaS NRR around 101%, with the 75th percentile around 110%. Benchmarks vary by ACV, customer segment, pricing model, and expansion opportunity, so compare NRR against companies with a similar business model and against your own historical cohorts.
Tools: Billing or subscription systems for recurring-revenue movements; CRM and customer-success platforms for account context; BI tools for cohort-level NRR reporting.
Advanced & Future-Focused Metrics
Deal Velocity
Deal velocity shows how efficiently qualified opportunities move through the pipeline and generate revenue. It combines opportunity volume, average deal value, win rate, and sales-cycle length, making it useful for understanding whether pipeline growth is translating into revenue quickly enough.
A slowing velocity can come from fewer qualified opportunities, smaller deal values, weaker win rates, or a longer B2B sales cycle. Track these components separately so you can identify whether the real problem is pipeline quality, conversion, deal size, or stage delays.
Formula: Pipeline Velocity = (Qualified Opportunities × Average Deal Value × Win Rate) ÷ Average Sales Cycle Length
Example: 40 qualified opportunities × $25,000 average deal value × 25% win rate ÷ 60-day sales cycle = approximately $4,167 in pipeline velocity per day.
Directional benchmark: There is no universal “good” deal-velocity number because it changes significantly by ACV, market segment, sales motion, and cycle length. Compare velocity against your own historical periods and separately across SMB, mid-market, and enterprise pipelines.
Tools: Salesforce or HubSpot for opportunity, win-rate, deal-value, and cycle data; Clari or BI tools for stage aging and pipeline-velocity analysis.
Predictive Conversion
Predictive conversion builds on lead scoring by using historical outcomes and machine-learning patterns, firmographic data, behavioral signals, and engagement patterns to estimate which leads, accounts, or deals are most likely to convert. These models help sales and marketing teams prioritize attention, routing, outreach, and budget toward opportunities with stronger conversion potential.
Predictive scores should not be treated as proof that a lead or deal will close. Model quality depends on the accuracy and volume of the underlying data, and scores should be continuously validated against actual conversion outcomes.
Example: Deal A receives a 75% predicted win likelihood based on strong ICP fit, multi-threaded engagement, recent high-intent activity, and patterns similar to historical closed-won deals. Deal B receives 20% because engagement has stalled and only one stakeholder is active. The score helps the team prioritize Deal A, but reps should still apply qualification and deal context before acting.
Directional benchmark: There is no universal “good” predictive conversion score because models, training data, time horizons, and scoring thresholds differ by platform and business. Measure model quality by whether higher-scored leads or deals consistently convert at materially higher rates than lower-scored groups.
Tools: HubSpot predictive lead/deal scoring or Salesforce Einstein for conversion propensity and prioritization; CRM reporting or BI tools for comparing predicted scores with actual outcomes.
Multi-Touch Attribution
Multi-touch attribution assigns conversion or revenue credit across multiple interactions that occur before a lead, opportunity, or customer converts. In B2B, this is often more useful than first-touch or last-touch attribution because buying journeys can include content, ads, webinars, email, sales conversations, website visits, and other interactions across a long decision cycle.
The goal is not to identify one “winning” channel. Instead, use attribution to understand which combinations of touchpoints consistently appear before qualified pipeline and closed-won revenue. Different models—such as linear, time-decay, U-shaped, or W-shaped attribution—will distribute credit differently, so the model should match the question you are trying to answer.
Example: A buyer first discovers your company through LinkedIn, later reads two blog posts, attends a webinar, receives nurture emails, and finally requests a demo. A multi-touch model distributes credit across those interactions instead of assigning the entire conversion to the demo request.
Interpretation: Attribution should be treated as directional evidence, not perfect proof of causation. Combine tracked attribution with pipeline progression, win rates, self-reported source data, and broader influence signals—especially for B2B activity that happens outside fully trackable channels.
Tools: HubSpot multi-touch revenue attribution, Marketo Measure, or BI-based attribution models connected to CRM opportunity and revenue data. HubSpot currently supports multiple attribution models for comparing how different interactions contribute to conversions.
Conclusion
Tracking B2B conversion metrics is most useful when every metric is tied to a specific funnel stage and business decision. Start with core stage-to-stage conversion rates such as Lead → Customer, MQL → SQL, SQL → Opportunity, and Opportunity → Closed-Won, then connect those results with CAC, LTV:CAC, retention, expansion, and pipeline velocity.
Benchmarks can help you identify where performance may be unusually strong or weak, but they should remain directional. Your own historical performance by channel, segment, deal size, and sales motion provides the most useful baseline for deciding where to improve.
The goal is not to track every available KPI. Build a measurement system that helps marketing, sales, and customer success identify funnel leaks, prioritize the right improvements, and understand which activities are actually contributing to pipeline and revenue. A well-defined B2B sales funnel makes those conversion metrics much easier to interpret in context.
Tracking the Numbers Is Only the First Step
If your funnel is generating activity but not enough qualified pipeline, Only-B2B can help you identify the gaps, engage the right accounts, and build demand generation programs focused on measurable business outcomes.

Vikas Bhatt is the Co-Founder of ONLY B2B, a premium B2B lead generation company that specializes in helping businesses achieve their growth objectives through targeted marketing & sales campaigns. With 10+ years of experience in the industry, Vikas has a deep understanding of the challenges faced by businesses today and has developed a unique approach to lead generation that has helped clients across a range of industries around the globe. As a thought leader in the B2B marketing community, ONLY B2B specializes in demand generation, content syndication, database services and more.