
Many sales teams enter the final weeks of a quarter believing the pipeline is strong. The CRM shows a lot of open opportunities, forecasts appear confident, and activity levels across the team remain high. Yet when the quarter closes, the numbers fall short.
More often, the pipeline simply never contained enough qualified opportunity value to support the revenue target.
This is where pipeline coverage becomes important. According to HubSpot, organizations that maintain consistent pipeline coverage are far more likely to achieve predictable revenue outcomes.
The metric reveals whether the pipeline can realistically support the quota before the revenue gap appears. Something closely tied to how effectively your B2B lead generation strategy is driving qualified opportunities.
Understanding the sales pipeline coverage ratio allows leaders to identify risk early and correct it before it reaches the forecast.
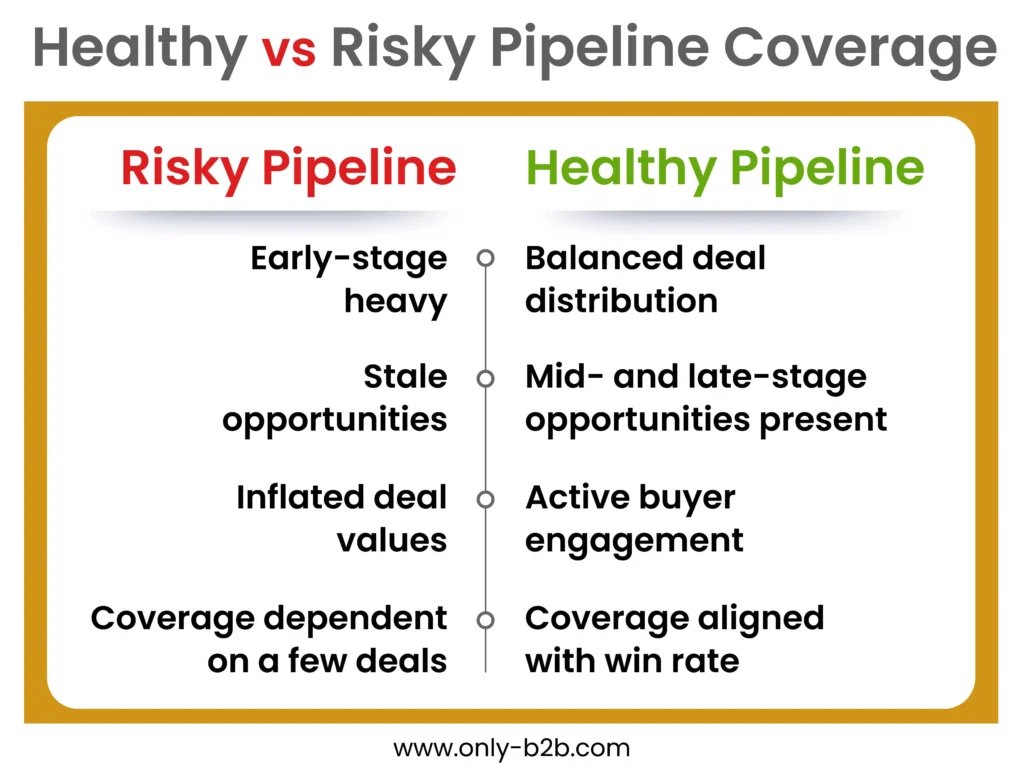
Table of Contents
- 1 What Is Sales Pipeline Coverage Ratio?
- 2 Pipeline Coverage Ratio Formula
- 3 What Is an Ideal Pipeline Coverage Ratio?
- 4 How Win Rate Impacts Coverage Needs
- 5 Pipeline Coverage & Sales Cycle Length
- 6 Segment-Based Pipeline Coverage
- 7 Rep-Level vs Company-Level Pipeline Coverage
- 8 Common Pipeline Coverage Mistakes
- 9 How to Improve Your Pipeline Coverage Ratio
- 10 FAQs
- 10.1 What is the sales pipeline coverage ratio?
- 10.2 How do you calculate pipeline coverage ratio?
- 10.3 What is considered a good pipeline coverage ratio?
- 10.4 Why does pipeline coverage matter for revenue forecasting?
- 10.5 How does win rate affect required pipeline coverage?
- 10.6 Can pipeline coverage be too high?
- 10.7 What factors influence pipeline coverage?
- 11 Conclusion: Close the Revenue Gap Before It Happens
What Is Sales Pipeline Coverage Ratio?
The sales pipeline coverage ratio measures how much pipeline value exists compared to the revenue target a sales team needs to close.
In simple terms, it answers one question.
Do you have enough opportunities in the pipeline to realistically hit your revenue goal?
Sales leaders often assume pipeline volume automatically translates into revenue. The coverage ratio corrects that assumption by introducing probability into the conversation.
A pipeline may look large on the surface but still be insufficient once win rates, deal timelines, and qualification quality are considered.
This is why the metric has become a core sales pipeline metrics benchmark used by revenue leaders to assess pipeline health and forecasting confidence.
Instead of asking whether pipeline exists, the ratio asks whether enough pipeline exists.
Pipeline Coverage Ratio Formula
The pipeline coverage ratio formula is straightforward.
Pipeline Coverage Ratio = Total Pipeline Value / Revenue Target
To illustrate how to calculate pipeline coverage ratio, imagine a team carrying $3 million in open opportunities while their quarterly quota is $1 million.
The calculation becomes:
3,000,000 / 1,000,000 = 3
The team therefore has a pipeline coverage ratio example of 3x.
This means the pipeline currently contains three times the value required to reach the revenue target.
At first glance, this may appear sufficient. However the ratio alone does not determine whether the pipeline is healthy. The interpretation depends on win rates, sales cycle length, deal size variability, and segmentation across the business.
Pipeline coverage is therefore less about a static number and more about understanding the conditions behind it, including how effectively your content syndication strategy contributes to pipeline volume and quality.
What Is an Ideal Pipeline Coverage Ratio?
The commonly referenced benchmark for pipeline coverage ratio is 3x to 5x.
In practice, this means the total value of open opportunities should be roughly three to five times larger than the quota the team needs to close.
The assumption behind the rule is simple. If a team closes roughly one out of three deals, a 3x to 5x pipeline should theoretically produce enough wins to reach the target.
According to HubSpot, the companies that consistently have high coverage ratios typically achieve forecast rates above 90%.
But the ideal pipeline coverage ratio rarely remains identical across companies. Different industries, deal sizes, and buying processes create different coverage requirements.
Organizations with high close rates might operate comfortably with lower coverage. Teams selling complex enterprise solutions often require higher coverage because fewer deals close and timelines are longer.
The ratio should therefore be treated as a directional signal rather than a rigid rule.
When used properly, it becomes an early indicator of future revenue pressure.
How Win Rate Impacts Coverage Needs
Coverage ratios become more precise when win probability enters the equation.
The relationship can be expressed with a simple calculation.
Required Coverage = 1 / Win Rate
This is where win rate impact becomes visible.
If a sales team closes 25 percent of their opportunities, the required coverage becomes:
1 / 0.25 = 4
In this scenario the organization needs a 4x pipeline to confidently reach its target.
If the close rate improves to 33 percent, the required coverage drops closer to 3x.
Understanding this relationship transforms pipeline management and aligns closely with improving lead qualification and scoring processes to increase win rates.
Instead of chasing arbitrary pipeline volume, leaders can align coverage expectations with actual conversion performance.
The result is a more realistic foundation for revenue forecasting.
Pipeline Coverage & Sales Cycle Length
Enterprise deals often move through multiple stakeholders, budget approvals, and evaluation phases. These steps extend deal timelines and reduce the number of opportunities that close within a quarter.
As cycle length increases, organizations typically require greater pipeline coverage ratio to protect their forecast.
Short cycle environments such as transactional software or SMB products operate differently. Deals progress faster, and new opportunities can enter the pipeline quickly, allowing coverage ratios to remain lower without introducing the same level of risk.
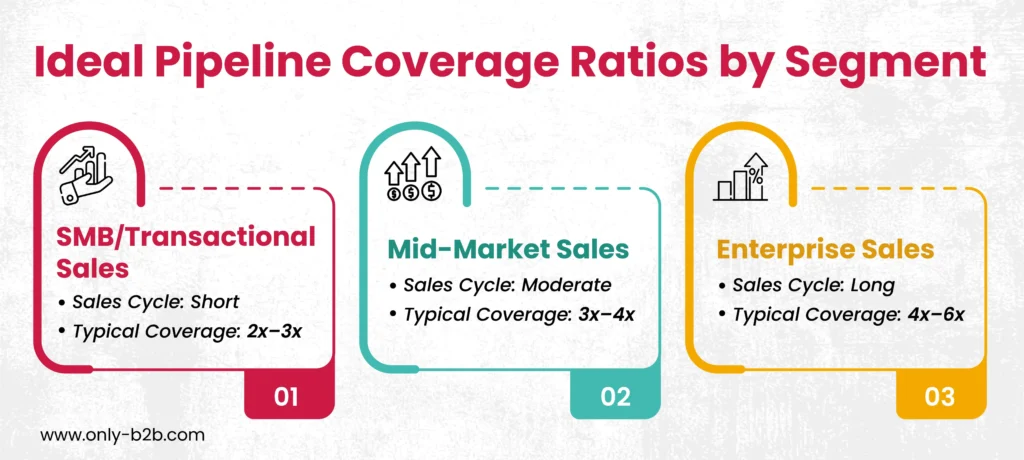
Segment-Based Pipeline Coverage
Pipeline requirements also shift across segments of the business.
Enterprise accounts typically involve higher ACV, longer buying committees, and more complex decision processes. These dynamics create slower conversion patterns and higher variability in outcomes, which is why many organizations rely on B2B content syndication services to generate high-intent enterprise leads.
SMB segments operate with smaller deal sizes but faster movement through the funnel.
This difference makes revenue segmentation an important lens for analyzing coverage.
A company selling across enterprise, mid-market, and SMB should avoid applying a single coverage expectation across all segments.
Each segment produces different pipeline behavior and therefore requires its own interpretation of the pipeline coverage ratio.
Rep-Level vs Company-Level Pipeline Coverage
Pipeline metrics become more meaningful when examined at multiple levels of the organization.
At the rep level, the goal is to understand whether an individual salesperson has enough pipeline to realistically reach their quota.
Rep-Level Coverage Formula:
Rep Pipeline Coverage = Individual Rep Pipeline Value / Individual Rep Quota
For example, if a salesperson carries $900,000 in qualified opportunities and their quarterly quota is $300,000, the calculation becomes:
900,000 / 300,000 = 3
This rep therefore has 3x coverage against their quota. Looking at coverage this way helps managers identify early whether a rep is under-pipelined or structurally unable to hit the target regardless of activity.
At the organizational level, the metric evaluates whether the entire revenue engine is producing enough opportunity value to support the company’s revenue target.
Organization-Level Coverage Formula:
Company Pipeline Coverage = Total Company Pipeline Value / Total Revenue Target
For example, if the total pipeline across all teams is $20 million and the company’s quarterly revenue target is $5 million, the coverage ratio becomes:
20,000,000 / 5,000,000 = 4
This indicates the organization is operating with 4x pipeline coverage.
Examining both perspectives improves visibility into rep performance and overall pipeline balance.
Common Pipeline Coverage Mistakes
Pipeline coverage is only useful when the pipeline data reflects real buying activity. When deals are misrepresented or outdated, the ratio creates false confidence instead of visibility.
Ignoring deal stage and maturity when calculating coverage.
FixReview coverage by stage and ensure enough mid- and late-stage opportunities exist to realistically convert.
Stale or inactive deals remain in the pipeline.
FixRemove or downgrade opportunities with no engagement for 45–60 days to prevent inflated coverage.
Applying a generic 3x rule regardless of win rates.
FixAlign the required ratio with historical close rates so coverage reflects real conversion performance.
Treating all pipelines the same across reps or territories.
FixSegment coverage by rep, territory, and deal type to reveal actual pipeline gaps.
Overreliance on a few large opportunities.
FixMaintain balanced deal distribution so coverage does not depend on single outcomes.
These patterns are among the most common sales forecasting mistakes and often explain why coverage appears healthy while revenue outcomes fall short.
How to Improve Your Pipeline Coverage Ratio
Improving pipeline coverage requires strengthening both pipeline creation and pipeline discipline. The objective is not just more opportunities but the right opportunities at the right stages.
Increase consistent pipeline creation
Build predictable demand generation programs that continuously feed qualified opportunities into the funnel.
Develop a disciplined outbound motion
Use a targeted b2b outbound lead generation strategy to generate a pipeline in high‑fit accounts when inbound demand slows.
Enforce strict qualification standards
Ensure every opportunity reflects genuine buyer intent with clear next steps before progressing.
Maintain pipeline hygiene
Regularly remove stale deals and update stage probabilities so coverage calculations remain accurate.
Track pipeline creation and coverage gaps
Monitor weekly pipeline creation targets to ensure enough opportunities exist to support future revenue goals.
When applied consistently, these practices improve pipeline depth while preserving accuracy, resulting in stronger coverage and more reliable revenue forecasting.
FAQs
What is the sales pipeline coverage ratio?
The sales pipeline coverage ratio compares total open opportunity value against the revenue target for a given period. It helps determine whether the current pipeline is large enough to realistically achieve the quota.
How do you calculate pipeline coverage ratio?
Divide the total value of all qualified pipeline opportunities by the revenue target. This produces the coverage multiple used to evaluate pipeline sufficiency.
What is considered a good pipeline coverage ratio?
Many organizations use the 3x benchmark, meaning pipeline value should be about three times more than the revenue target. The ideal coverage ratio can vary depending on close rate and deal complexity.
Why does pipeline coverage matter for revenue forecasting?
The ratio highlights potential shortfalls months before the revenue gap appears in the forecast. It helps leaders identify whether pipeline creation needs to increase.
How does win rate affect required pipeline coverage?
Lower close rates require higher pipeline coverage. If a team wins only 25 percent of deals, the required pipeline may need to reach roughly four times the revenue target.
Can pipeline coverage be too high?
Extremely high coverage can indicate inefficient qualification or inaccurate opportunity values. Healthy coverage should reflect realistic deals that have a genuine probability of closing.
What factors influence pipeline coverage?
Win rate, sales cycle length, deal size variability, and segmentation across markets all influence the coverage required to maintain stable revenue outcomes.
Conclusion: Close the Revenue Gap Before It Happens
Revenue predictability rarely comes from late quarter heroics. It comes from visibility earlier in the system.
The sales pipeline coverage ratio provides that visibility by revealing whether the pipeline structure can realistically support future targets.
When organizations treat pipeline coverage as a living indicator rather than a static metric, forecasting improves and surprises become less frequent.
If your pipeline coverage has not been evaluated recently, it may be time to examine it more closely. Because most revenue gaps do not begin in the forecast. They begin in the pipeline.

Vikas Bhatt is the Co-Founder of ONLY B2B, a premium B2B lead generation company that specializes in helping businesses achieve their growth objectives through targeted marketing & sales campaigns. With 10+ years of experience in the industry, Vikas has a deep understanding of the challenges faced by businesses today and has developed a unique approach to lead generation that has helped clients across a range of industries around the globe. As a thought leader in the B2B marketing community, ONLY B2B specializes in demand generation, content syndication, database services and more.